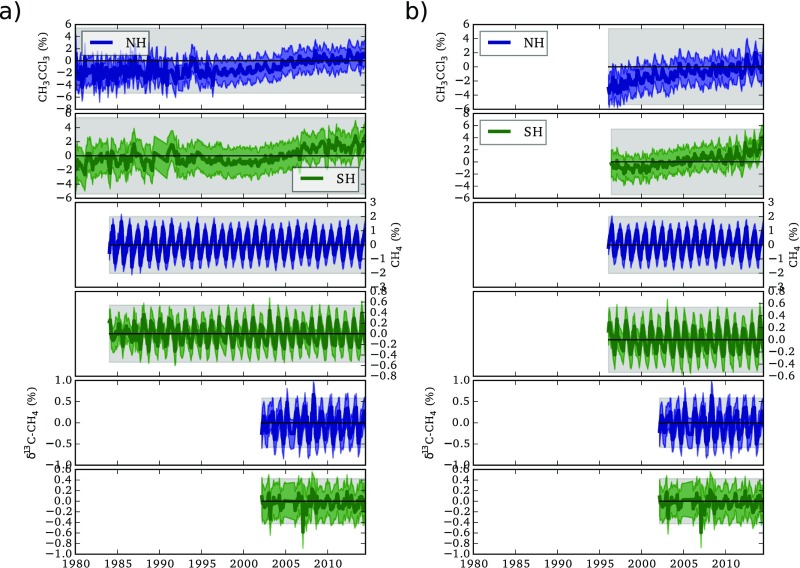
Fig. S3.
Percentage difference between modeled and observed mole fractions (model/data) for CH3CCl3, NOAA CH4, and INSTAAR C-CH4 for (A) the AGAGE CH3CCl3 inversion and (B) the NOAA CH3CCl3 inversion. Gray shading indicates the diagonal elements of the model representation uncertainty covariance matrix (1 sigma). Blue lines show the median northern hemisphere (NH) mole fraction, and green lines show the southern hemisphere (SH) mole fraction. The blue and green shading shows the 1-sigma uncertainty in the a posteriori mole fractions. A seasonal cycle is apparent in the CH4 and C-CH4 residual. This finding is because we have assumed that CH4 emissions have no seasonal cycle, which is a clear oversimplification but one that we do not expect to have any impact on our results concerning quantities derived on timescales of at least 1 y. The figure also shows a (nonstatistically significant) trend in the CH3CCl3 residual, which is not inconsistent with the observations, because we have included off-diagonal terms in our representation uncertainty covariance that allow for multiyear trends of the order of a few percent. Therefore, the a posteriori uncertainties in OH and other quantities will be consistent with potential drifts in the atmospheric CH3CCl3 data, such as those shown in the figure. Fig. S4 shows the outcome of an inversion performed with this correlation-length scale set to zero and that it has little major impact on the median solution. In this solution, the “drift” between the observations and the posterior model is negligible.

