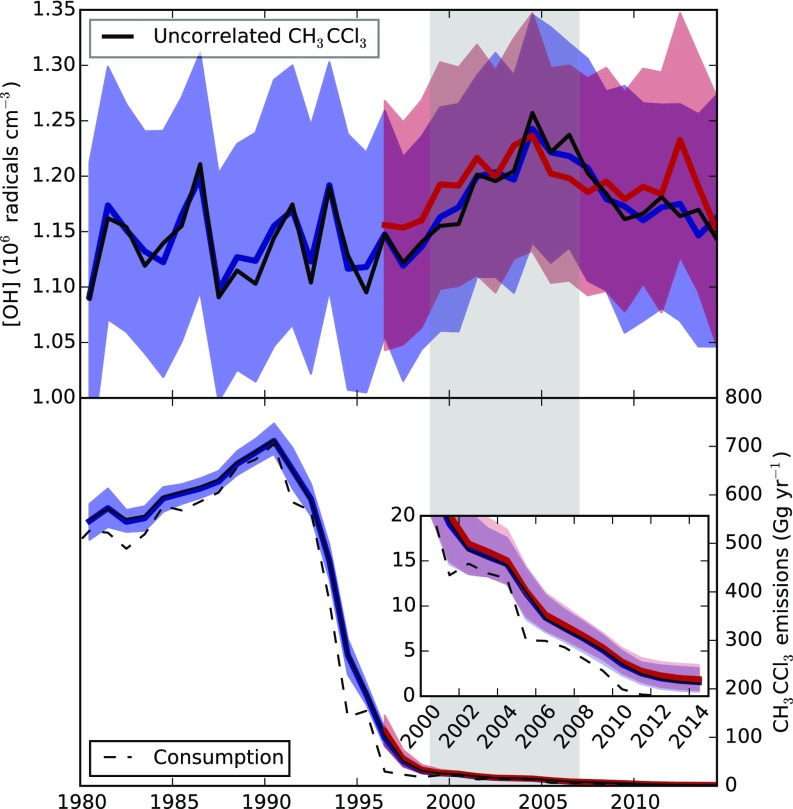
Fig. S4.
Outcome of inversion using CH3CCl3 data alone from either the AGAGE network (blue) or NOAA network (red). Upper shows the derived OH concentration, and Lower shows the derived CH3CCl3 emissions. Shading indicates the and percentile range, and the solid lines show the medians. The black lines show the AGAGE-only inversion with an assumed zero temporal correlation-length scale in the model mismatch uncertainty, which removes the long-term drift in the model data residual (Fig. S3). Inset shows CH3CCl3 emissions from 2000 to 2014.

