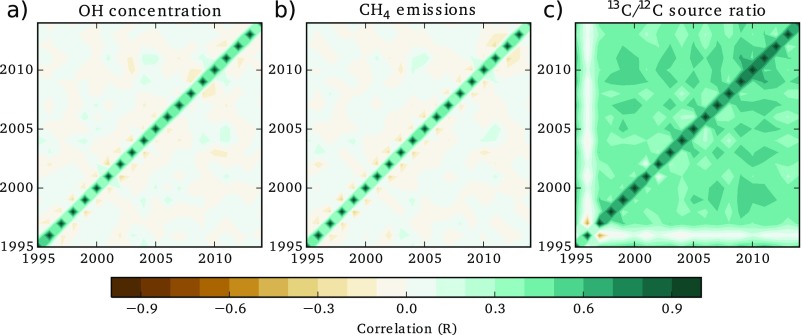
Fig. S5.
Correlation matrices for three annually derived quantities: (A) OH concentrations, (B) CH4 emissions, and (C) 13C/12C source ratios. The figure shows relatively small autocorrelation for OH and CH4 but significant off-diagonal elements for the source signature, indicating that estimates of the source signature in any 1 y are significantly correlated with surrounding years.

