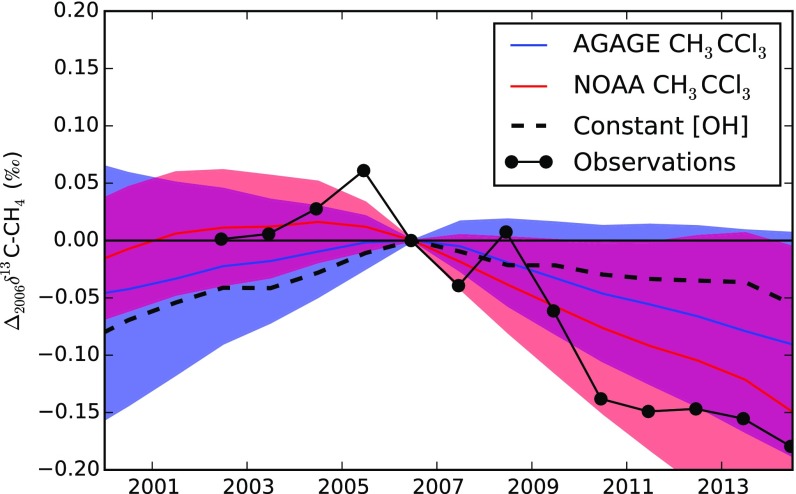
Fig. S6.
Simulation of the change in global C-CH4 relative to 2006 based on varying OH concentrations from the AGAGE and NOAA inversions (blue and red, respectively), with total CH4 emissions and its source 13C/12C ratio held fixed and varying CH4 emissions from the “constant OH” inversion with the source 13C/12C ratio held constant (dashed line). The black points indicate the observed global mean C-CH4. Each of these signals is a transient response in the model. Over timescales on the order of decades, C-CH4 returns to the values before any perturbations in either the OH concentration or the bulk emissions [similar behavior and response timescales were noted previously (29, 61)].

