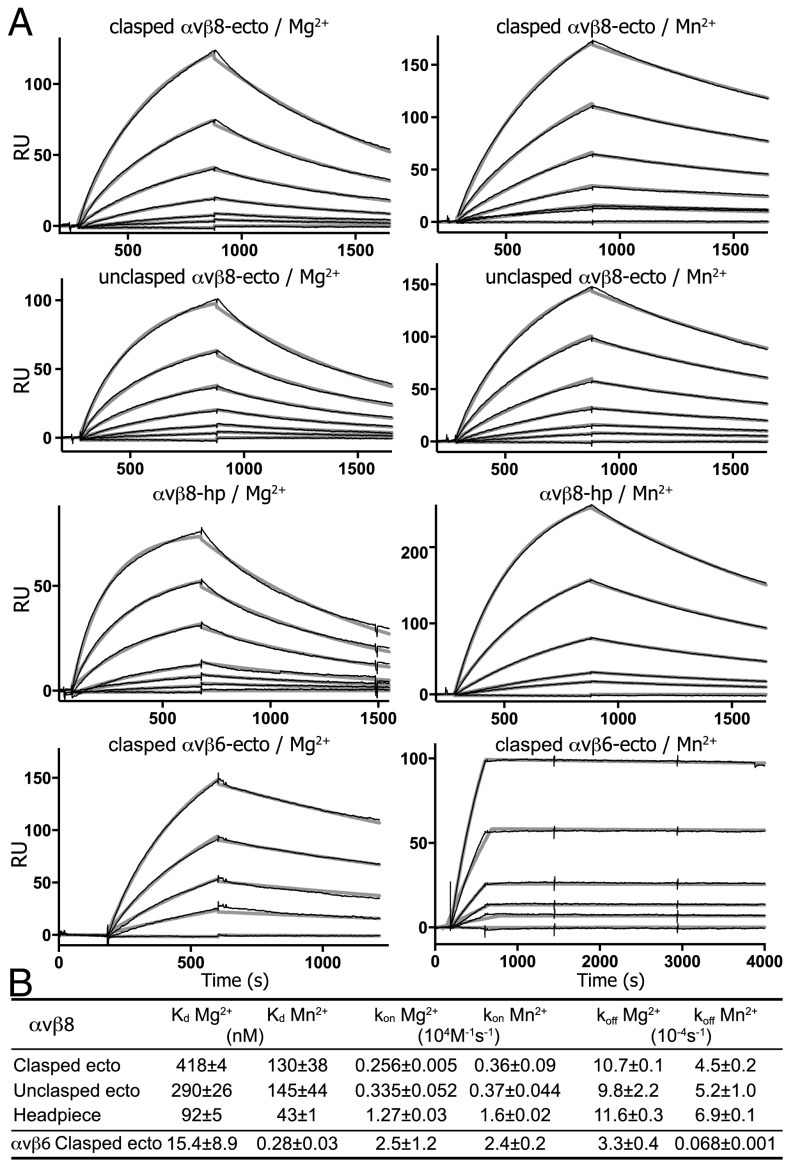
Fig. 4.
Kinetics measurements of αvβ8 and αvβ6 binding to pro-TGF-β1 by SPR. (A) Sensorgrams show the overlay of fitting curve (thicker gray) and experimental curve (thinner black) of SPR measurement. Constructs and metal ions used are indicated. Concentrations were 800, 400, 200, 100, 50, 25, and 0 nM for the αvβ8 ectodomain; 400, 200, 100, 50, 25, 10, and 0 nM in Mg2+ and 200, 100, 50, 25, 10, and 0 nM in Mn2+ for the αvβ8 headpiece; and 200, 100, 50, 20, and 0 nM in Mg2+ and 100, 50, 20, 10, 5, and 0 nM in Mn2+ for the αvβ6 ectodomain. (B) Affinities and kinetic rates. Values are mean ± difference from mean of two independent experiments.

