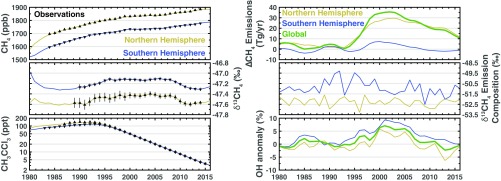
Fig. 2.
Most likely solution. Left column shows observed (black triangles) and modeled (solid lines) concentrations of atmospheric CH4 (Top), CH4 (Middle), and methyl chloroform (Bottom). The Northern Hemisphere is yellow and the Southern Hemisphere is blue. Right column shows the methane emissions (plotted as a deviation from the constant prior emissions; Top), the isotopic composition of the methane emissions (Middle), and the OH anomaly relative to a global mean concentration of molecules (molec)/cm3 (Bottom).

