Significance
Cas9, a protein derived from the bacterial CRISPR/Cas9 immune system, relies on a programmable single-guide RNA (sgRNA) to bind specific genomic sequences. Cas9 complexed with sgRNA readily binds on-target DNA, but models that can predict the specificity of this process have proven elusive. To investigate this system from a biophysical perspective, we applied a massively parallel method for profiling protein–DNA interactions to quantify nuclease-dead Cas9 (dCas9) binding across thousands of off-target sequences. We observe that mismatches at certain positions of the guide lead to complex dCas9 dissociation patterns, and multiple mismatches between the gRNA and DNA at nonseed bases can produce substantial changes in observed association and dissociation, suggesting the possibility of kinetic and thermodynamic tuning of Cas9 behavior.
Keywords: DNA, molecular biophysics, kinetics, sequencing, CRISPR
Abstract
The bacterial adaptive immune system CRISPR–Cas9 has been appropriated as a versatile tool for editing genomes, controlling gene expression, and visualizing genetic loci. To analyze Cas9’s ability to bind DNA rapidly and specifically, we generated multiple libraries of potential binding partners for measuring the kinetics of nuclease-dead Cas9 (dCas9) interactions. Using a massively parallel method to quantify protein–DNA interactions on a high-throughput sequencing flow cell, we comprehensively assess the effects of combinatorial mismatches between guide RNA (gRNA) and target nucleotides, both in the seed and in more distal nucleotides, plus disruption of the protospacer adjacent motif (PAM). We report two consequences of PAM-distal mismatches: reversal of dCas9 binding at long time scales, and synergistic changes in association kinetics when other gRNA–target mismatches are present. Together, these observations support a model for Cas9 specificity wherein gRNA–DNA mismatches at PAM-distal bases modulate different biophysical parameters that determine association and dissociation rates. The methods we present decouple aspects of kinetic and thermodynamic properties of the Cas9–DNA interaction and broaden the toolkit for investigating off-target binding behavior.
CRISPR-associated protein 9 (Cas9) is programmed to bind its target DNA by a guide RNA (gRNA) that, once loaded, forms a ribonucleoprotein (RNP) complex. The Streptococcus pyogenes CRISPR system, the most extensively studied and applied system to date, targets a 23-bp DNA sequence containing (i) an “NGG” protospacer adjacent motif (PAM) element downstream of the single-guide RNA (sgRNA) target DNA (1) and (ii) a 20-bp sequence upstream of the PAM bearing complementarity to the gRNA (2). Genome engineering applications leverage the nuclease activity of the Cas9 RNP, but Cas9 engineered to lack the residues required for cleavage [dCas9 (nuclease-dead Cas9)] has proven valuable by enabling the creation of customizable and programmable DNA binding elements that can activate and repress gene expression with high precision (CRISPRa and CRISPRi) (3).
The biophysical underpinnings of the Cas9 target search have been investigated both by directed biochemical assays (4, 5) and through measurements of off-target Cas9 activity (6–11). These studies have led to a model for binding wherein Cas9 proceeds through a series of steps starting with PAM recognition, followed by DNA melting, RNA strand invasion, and heteroduplex formation dependent on complementarity with a 5–10-bp seed. Structural data have further suggested that conformational changes in the HNH domain reposition catalytic residues and permit allosteric regulation of the RuvC domain. This conformational gating ensures that cleavage occurs only in the context of substantial homology between gRNA and target (12, 13).
The specificity of Cas9 DNA binding is crucial for all potential applications of Cas9’s RNA-programmable targeting. Localization of dCas9 using chromatin immunoprecipitation followed by sequencing (ChIP-seq) has indicated that Cas9 stably binds sequences even with multiple mismatches at PAM-distal bases (9, 10, 14); however, analysis of CRISPRi/a screens has suggested that nearly all mismatches across the length of the target contributed to binding specificity (15). Neither of these approaches gauges occupancy over time, which makes direct measurement of biophysical parameters governing dCas9’s interactions with target sequences impossible. Thus, there exists an acute need for scalable approaches for exhaustive profiling of off-target binding in vitro that can shed light on the full extent to which sequence controls dCas9 biophysical binding parameters, allowing for both comprehensive characterization of off-target potential of specific guides and the generation of sufficient data for a predictive model of the physical process underlying dCas9 affinity.
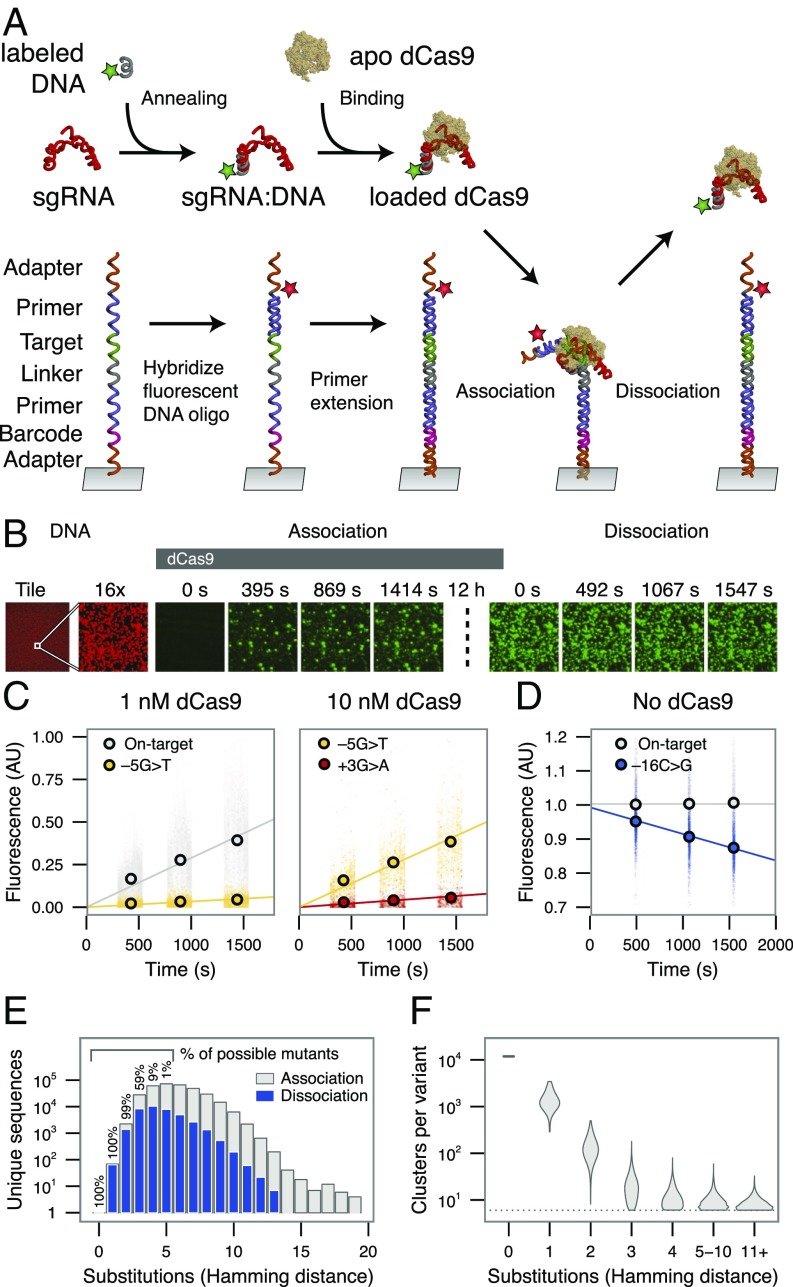
To investigate the sequence determinants of Cas9 binding, we performed a direct, comprehensive survey of dCas9 off-target binding potential. We generated a library of mutant targets on a massively parallel array and assessed binding of fluorescently labeled dCas9–sgRNA complexes in real time (Materials and Methods) (16). We chose a well-characterized 20-bp phage λ-target sequence (4, 13) and constructed a library of modified targets with maximal coverage of double substitutions. Flanking Illumina sequencing adapters (Fig. 1A) permitted cluster generation and sequencing on an Illumina flow cell. Following sequencing, the GAIIx flow cell comprised a 2D array of clonal, relaxed-state DNA clusters with the template strand tethered to the surface of the flow cell. Each cluster of identical potential DNA binding sites contained anywhere from 0 to 20 substitutions in the 20-nucleotide λ-target sequence plus 3-nucleotide PAM.
Fig. 1.
Quantifying dCas9 binding behavior on a massively parallel array. (A) Experimental procedure for high-throughput biochemical profiling. A fluorescent DNA oligo hybridized to the dCas9 sgRNA was loaded into the apo-dCas9. In parallel, an Illumina sequencing-compatible DNA construct was both labeled and made double-stranded by extending a second fluorescent oligo. dCas9 was flowed into the chamber, allowing association with double-stranded DNA. A dissociation experiment was then performed by quantifying the decrease in dCas9 signal upon dilution or chase. (B) Example images taken in two channels on the array, Alexa Fluor 647-labeled DNA (red) and Cy3-labeled dCas9 (green). A 12-h incubation, meant to saturate the clusters with dCas9, separates association from dissociation experiments (dotted line). For most clusters, signal accumulated in the on-rate experiment largely remains throughout the dissociation. (Magnification: right nine panels, 16×.) (C and D) Examples of (C) association and (D) dissociation lines fit to different targets. The +1 base refers to the first base of the PAM, −1 to the most PAM-proximal base, and −20 to the most PAM-distal base. (E) The total number (y axis) and percentage (in text) of possible targets profiled for each number of substitutions from the on-target site. Only a fraction of sequences with quantified on-rates are profiled for off-rates (blue) with high confidence. (F) Clusters per variant for targets with the given number of substitutions. AU, arbitrary units.
After using the high-throughput sequencing data to define the spatial coordinates of sequence clusters in the library, the flow cell was placed into a modified GAIIx instrument (17) for biochemical profiling. Programmed Cy3-labeled RNP complexes were introduced into the flow cell at either 1 nM or 10 nM concentration (SI Text) and left to incubate 12 h overnight. Following this incubation, the flow cell was washed with dCas9-free buffer and imaged to track dissociation of dCas9. During association and dissociation experiments, images were collected across all 120 tiles of the flow cell lane with 532-nm excitation (Fig. 1B). For each experiment, initial apparent on-rates and off-rates were calculated by fitting fluorescence values for each off-target, which estimate presteady state on-rates and initial observed off-rates (Fig. 1 C and D and Materials and Methods). Because dCas9’s strand invasion behavior is not expected to obey simple two-state binding dynamics, we treat these parameters as empirical measurements of binding and unbinding.
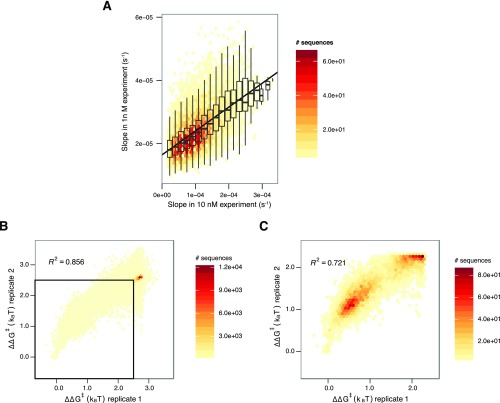
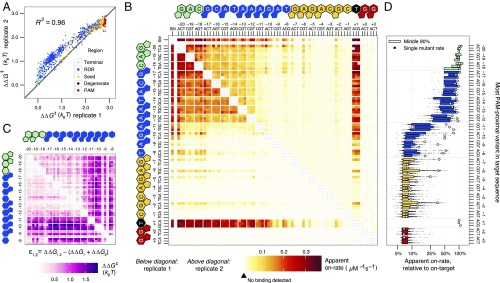
Apparent initial association rates were obtained for 84,554 sequences, including all single mutants, 99% of all possible double mutants, and 59% of all possible triple mutants, as well as 64,594 higher order mutants (Fig. 1E). Datasets (1 and 10 nM) were merged to evaluate apparent on-rates jointly (Materials and Methods and Fig. S1A). Single mutants were generally measured across >1,000 clusters. Sequences with four or more mismatches were typically measured across 20 or fewer clusters due to the larger mutational space (Fig. 1F). Across single and double mutants, dCas9 initial association rates were highly reproducible (R2 = 0.962) (Fig. 2A). Among all potential binding targets, reproducibility was slightly reduced due to lower per-sequence cluster counts (R2 = 0.856; Fig. S1 B and C).
Fig. S1.
Merging of datasets and reproducibility of on-rates for 1 and 10 nM experiments. (A) The initial apparent on-rates from 10 nM data were extrapolated into apparent on-rates expected from 1 nM using a line fit to the on-rates for different sequences, shown above in scatter plot. The slope of the fit line is 0.076 (i.e., on-rates in the 1 nM data were 7.6% of that seen in the 10 nM data). Both differential protein loss in the microfluidic lines and pipetting error may explain the deviation from the expected 10%. (B) All mutant sequences are shown in this scatter plot. Most sequences are concentrated in the upper right, likely corresponding to PAM recognition kinetics. (C) Zooming into the indicated square in A highlights more than marginal binding. Sequences with high error in on-rate estimates (corresponding to 2% of sequences fit with on-rates) were removed before calculating correlations.
Fig. 2.
Deep profiling of dCas9 observed initial association rates across a range of potential off-target sequences. (A) dCas9 effective energy barrier reproducibility (natural log of the ratio of observed initial on-rate to on-target observed initial on-rate) for single and double mutants across replicates, calculated relative to the on-target DNA. Points are colored by the more PAM-proximal mutation position, excepting the degenerate base of the NGG PAM. (B) Apparent association rates for all single mutants (the series of tiles “SM,” horizontal and vertical) and double mutants (all other tiles) across both replicates, shown above and below the diagonal. Heat reflects higher on-rate for off-target sequences with the substitutions indicated on the x and y axes. Targets with at least six clusters but with no detectable binding were colored the minimum quantified rate. Double mutant cells lacking six clusters are left unfilled. (C) Epistasis in energy barriers for double mutants for the PAM-distal nucleotides. Nearly all pairs of mismatches have slower rates than expected by single mismatch estimates. Targets with mismatches in the seed were excluded owing to low variation in rate. (D) Distribution of higher order (>2) mutant on-rates summarized by their most PAM-proximal mutation (degenerate base excluded). Single mutants are highlighted in outlined white circles and correspond to the single mutant rate data in C.
Stark differences in apparent association rates between targets with intact and disrupted PAM GG dinucleotides agreed with known (d)Cas9 requirements for binding. All off-target DNA with mutations in the PAM GG dinucleotide exhibited approximately equivalent (and slow) association rates. Because most constructs contained at least one GG dinucleotide, either in the barcode or introduced in the λ-target sequence itself, we inferred that these association rates represented slowly accumulating background signal likely related to dCas9’s interrogation of PAM elements. Among off-targets lacking such a canonical PAM adjacent to the λ-target positions, we found that targets with no detectable signal on average contained fewer novel GG dinucleotides than those with small but detectable signal, both on the sgRNA sense strand (0.54 vs. 0.71 novel GGs per sequence, P < 1 × 10−280, Wilcoxon rank sums test) and on the strand complementary to the sgRNA (0.48 vs. 0.61, P < 1 × 10−280).
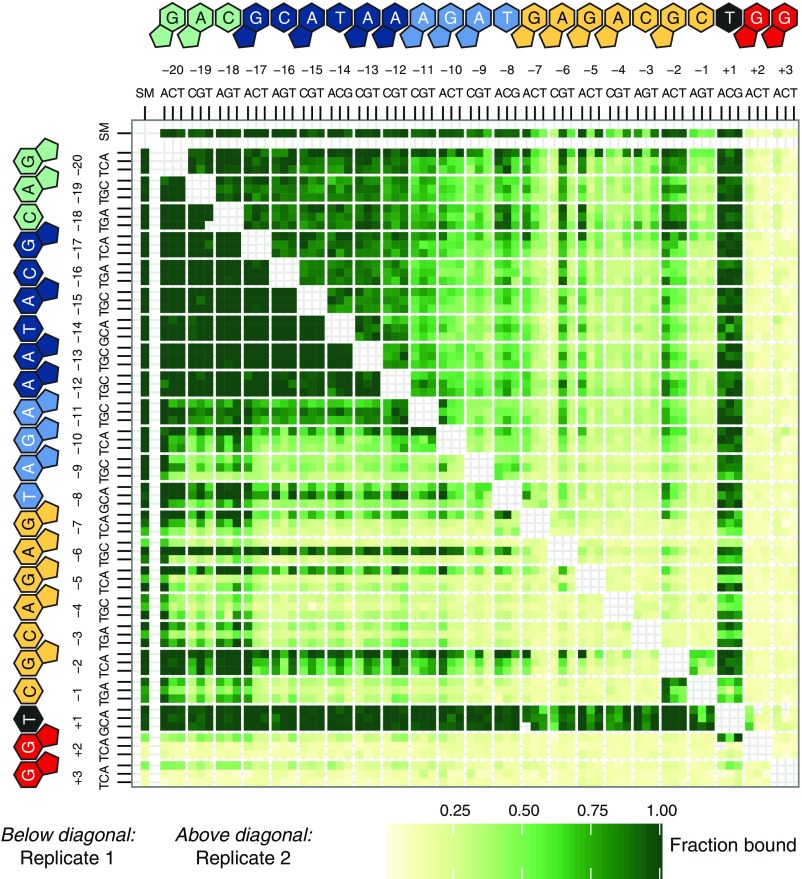
The extent to which dCas9 can recognize PAM sequences aside from GG dinucleotides—known as noncanonical PAMs—has been the subject of conflicting reports (7, 18, 19). At 10 nM dCas9, the initial association rate of NGA or NAG targets was similar to the PAM-scanning behavior we described; however, after equilibration 12 h later, both NGA and NAG PAMs exhibited more signal than other PAM mutants (Fig. S2), suggesting that these are indeed the two most prominent noncanonical PAMs.
Fig. S2.
Variation in dCas9 end occupancy levels at off-targets. The fraction of fluorescent signal relative to the on-target site is shown for each single mutant (row and column labeled SM) and double mutant (other tiles) off-target sequence following a 12-h incubation with 10 nM dCas9 in the flow cell.
We next examined the effect of single mismatches in the bases complementary to the sgRNA (positions −20 to −1) on apparent association rates for canonical dCas9 binding. We observed that mismatches in the ∼7-bp seed region (positions −1 through −7) caused substantial changes to these apparent initial association rates (Fig. 2B). Low association rates for seed-mismatched off-targets are due to rapid rejection of these targets by dCas9 following a PAM-dependent initial association. Substitutions outside the seed had more muted effects on apparent initial association rates, leading generally to <twofold changes in apparent on-rates. Although seed mismatches posed greater barriers to dCas9 binding than PAM-distal mismatches (positions −8 to −20), we found that apparent initial association rates were sensitive to both position and base identity of the mismatches between target and sgRNA (Fig. 2B).
Next we asked if the effect of multiple substitutions in one off-target could be predicted from the effective energy barriers faced by DNA templates possessing the constitutive single mismatches. We first applied a naive model under which energy barriers to dCas9 association on doubly mismatched DNA templates were additive. For this analysis, PAM and seed mismatches were not assessed, as canonical binding was largely abrogated and presumably reflected PAM-scanning behavior independent of mismatches. The identity of the degenerate NGG PAM base (position +1) had no detectable effect on apparent on-rate kinetics (Kolmogorov–Smirnov test P > 0.05), consistent with prior observations (8, 11, 20), and was also excluded from modeling. In the PAM-distal region (positions −8 to −20), we found two milieus of negative epistasis (Fig. 2C). For many PAM-distal bases (−12 to −20), double mutants exhibited slightly lower apparent initial association rates than expected under this naive model. The four bases adjacent to the seed (−8 to −11) showed a more exaggerated decline in apparent initial association rates when paired with a second mismatch (Fig. S3).
Fig. S3.
Parameterization of kinetic Monte Carlo strand invasion model and model evaluation against observed data. (A) dCas9 strand invasion was modeled with kinetic Monte Carlo simulations parameterized with an initial on-rate, PAM-association energy, transversion penalty, transition penalty, and a second protein association energy at a discrete position (which was also a fit parameter). Parameters were optimized by grid search by minimizing Euclidean distance of the observed data relative to the on-target simulation. (B) Each point is an off-target double mismatch sequence with a terminal nucleotide substitution (position −18, −19, or −20) colored by the position of a PAM-proximal mismatch. Double mutant energy barriers predicted from single mutant energy barriers (x axis) consistently underestimate the observed energy barriers (y axis). (C) Strand invasion simulations parameterized from the single mutant data also fail to predict the observed kinetics of double mutant binding, suggesting that this nonadditive effect cannot be captured by this thermodynamic model of strand invasion. The presence of an extremely PAM-distal or terminal mismatch raises the effective barrier height substantially beyond the effect of the PAM-proximal mismatch.
These patterns were also observed among targets with greater numbers of mismatches (Fig. 2D). Curiously, although the three terminal PAM-distal bases (−18 to −20) are considered dispensable for binding (21), and single mismatches in this region produced little change in association rate, we found that the presence of a second mismatch in the four bases adjacent to the seed (−8 to −11) greatly sensitized dCas9 to mismatches in the terminal nucleotides (Fig. 2C and Fig. S3B). This sensitization was comparable to that observed for other PAM-distal mutants (−12 to −17).
Double substitutions in the seed largely abrogated dCas9 occupancy even after 12 h of binding (Fig. S2). In contrast, the vast majority of single substitutions achieved high levels of occupancy at this time point, even for sequences with slow apparent initial association rates. We also observe considerable variation in the fraction of DNA ultimately bound by dCas9 for double substitutions, suggesting that PAM-distal mismatches that in isolation have little effect on dCas9 association can, in concert with other mismatches, substantially alter dCas9 binding at long time scales.
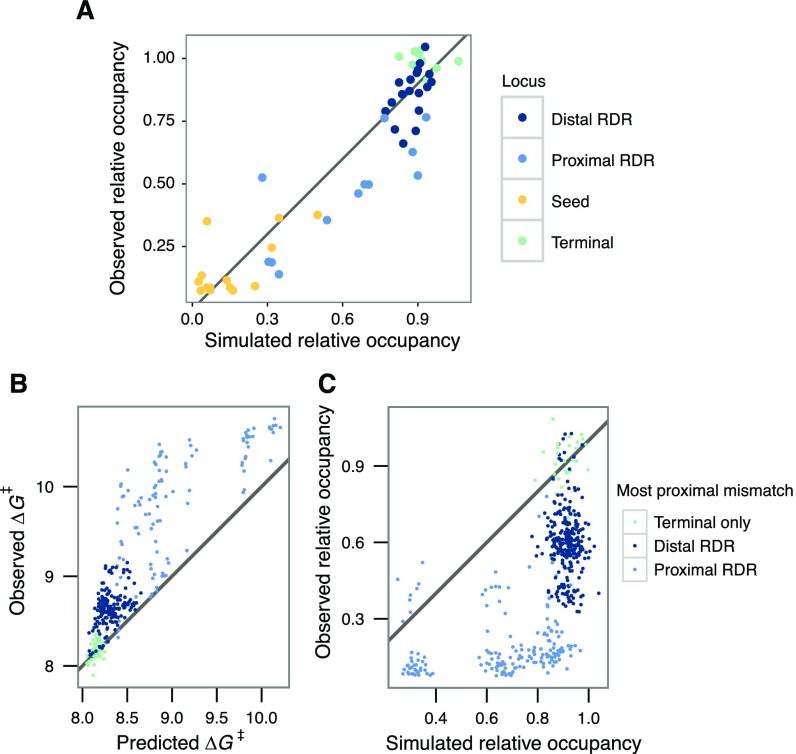
To obtain a more mechanistic understanding of how mismatches might impair dCas9 association kinetics, we fit a modified version of a previously described kinetic Monte Carlo strand invasion model (22) that could account for mutations throughout the guide sequence (Materials and Methods and Fig. S3A). This model gave reasonable predictions for single-base mutations but was unable to recapitulate the nonadditivity we observe in our double mutants (Fig. S3C).
To our knowledge, there has been no systematic characterization of how target mismatches at base-pair resolution effect changes in (d)Cas9 off-rates over long time scales. Biophysical data (22, 23) and modeling efforts (24) have suggested that target mismatches may modulate dCas9 off-rates, but methods for probing these features at scale generally lack the temporal resolution needed to probe these comparatively slow off-rates.
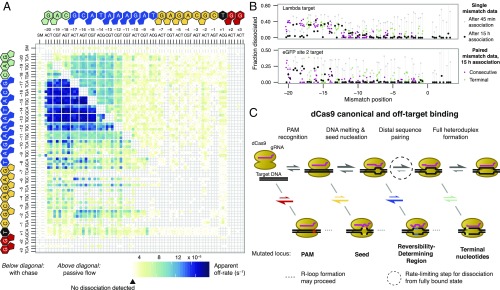
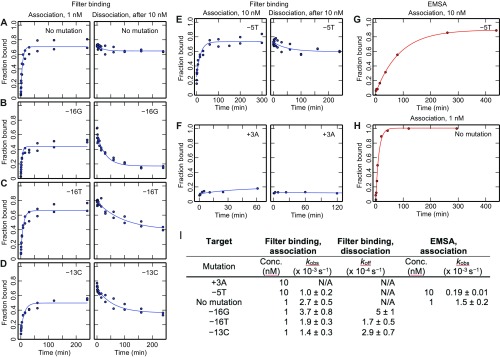
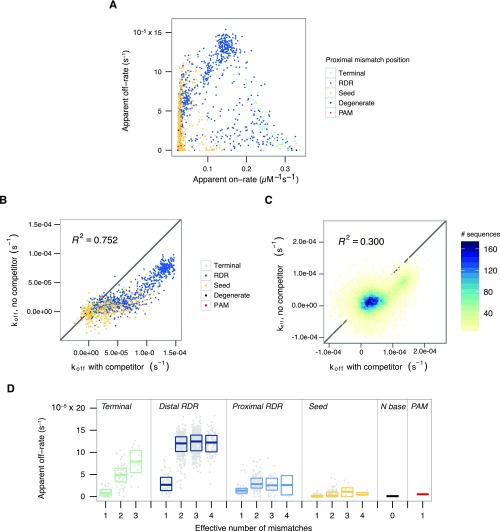
In our data, we report substantial variation in apparent initial dissociation rates across off-targets (Fig. 3A). In contrast to dCas9 apparent association rates, the apparent dCas9 dissociation rates we estimate are almost exclusively modulated not by the seed but by bases in the PAM-distal region; accordingly, we define a new region, corresponding to positions −8 to −17, as the “reversibility-determining region” or RDR, which modulates both association and dissociation of Cas9 at the time scale of minutes. Although dissociation was immeasurably slow for the on-target λ sequence, consistent with past investigations (4), we found that a single mismatch in the PAM-distal region (−16G) induced near complete dissociation of dCas9 within an hour. To confirm this unexpected behavior, the −16G construct, along with several other test sequences, were assayed for association and dissociation by radioactive filter binding assays (Fig. S4). In general, our data suggest that off-targets with high apparent dissociation rates tend to have lower apparent association rates. The converse, however, is not true. This suggests that the reversible binding we observe relies on subtle modulations of the multistep strand invasion process (Fig. S5A). The addition of unlabeled competitor DNA in the high-throughput sequencing flow cell (HiTS-FLIP) experiment yielded systematically higher dCas9 off-rates, but these data were still strongly correlated with passive flow experiments (R2 = 0.752; Fig. S5 B and C). These observations are broadly consistent with an initial scanning phase of dCas9 binding that is susceptible to interference by competitor DNA. Our report of 38,431 initial observed off-rates for dCas9 thus enables exploration of how different mismatches between target and sgRNA modulate the final state of dCas9 binding.
Fig. 3.
Variation in dCas9 dissociation rates suggests a model of Cas9 binding behavior. (A) dCas9 apparent off-rates for single and double mutants, as in Fig. 2B. Apparent off-rates are systematically higher in the presence of an unlabeled competitor dsDNA that prevents rebinding (below diagonal) than without (above diagonal). (B) Massively parallel filter-binding results for reversible binding at 10 nM dCas9. At shorter time scales (gray points), dissociation is most rapid for seed mutants for both targets. At longer time scales (all other points), dissociation is almost exclusively controlled by PAM-distal mismatches, either in isolation (black, positions –19 to –14) or when paired with a second mutation (green points). Consecutive mismatches in the seed show minimal dissociation after long association (pink points). (C) Model diagram for R-loop formation in different off-target contexts. Rates for protospacer mismatches are color-coded by off-target partition as in A. PAM and PAM-proximal mismatches affect early steps in the Cas9 target identification procedure, whereas distal mismatches influence later steps. Dissociation rates in A are likely products of the kinetics of unwinding of the R loop across the RDR. Dissociation rates associated with transient binding, as with most PAM mutants that fail to form R-loop structures, do not appreciably bind and thus are not captured in the dissociation experiment.
Fig. S4.
In-solution characterization of dCas9 association and dissociation. (A–F). Filter-binding measurements of association for the on-target sequence and five single mismatch targets. For dissociation, DNA was first incubated with 10 nM dCas9, and data represent time after quench with competitor DNA. (G and H) Gel shift measurement of association for the perfect target and the −5T mutant. (I) Observed kinetic on-rates, kobs, and off-rates, koff, from fits to the data. Association curves were fit to a first-order reversible binding reaction [f = (fmax − fmin)(1− exp(−kobs t))+ fmin] and dissociation curves to an exponential decay [f = (fmax − fmin)(exp(−koff t))+ fmin], where t is time and fmax and fmin are the minimum and maximum signals, respectively. The “No mutation” and −5T targets did not dissociate sufficiently for accurate quantification, and the +3 target did not show appreciable binding after 60 min in the filter assay. Conc, concentration.
Fig. S5.
Characterization of dCas9 apparent off-rates. (A) Single- and double-mutant on- versus off-rates, colored by the sequences’ more PAM-proximal mismatch. Apparent association and dissociation rates for off-targets share a complex relationship and appear to fall in one of three regions: near wild type (bottom right, mostly terminal mutants), fast off (top middle, mostly RDR mutants), or slow on, variable off (left, mostly seed mutants). (B) Single and double mutants colored by the more PAM-distal nucleotide clearly show that mutations in the reversibility-determining region dominate apparent dissociation rate behavior. Addition of unlabeled competitor DNA reveals faster apparent initial dissociation behavior. (C) Agreement across higher order (>2) mutants is lower. R2 is calculated postfiltering of noisy measurements or those with the highest 2% in estimated error. (D) Multiple mismatches increased the apparent initial off-rate in PAM-distal bases but not in seed bases. Mismatches in the −12 to −17 positions (the distal RDR) contributed most to reversible binding.
From these data, it appears that if gRNA strand invasion bypasses seed mismatches in off-target DNA, the final complex is still made highly stable via favorable PAM-distal base pairing. In contrast, R-loop formation over RDR mismatches can jeopardize the long-term stability of dCas9 binding, even with perfect seed complementarity. In further support of this hypothesis, we observe that multiple PAM-distal mismatches, especially in the most distal bases of the RDR (positions −12 to −17), trigger faster dissociation than that of the single mismatches alone (Fig. S5D).
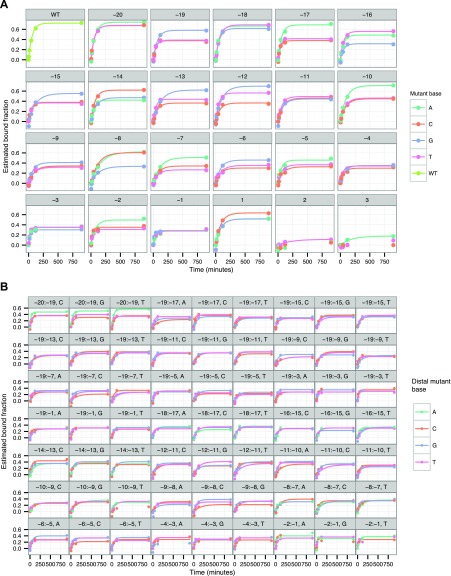
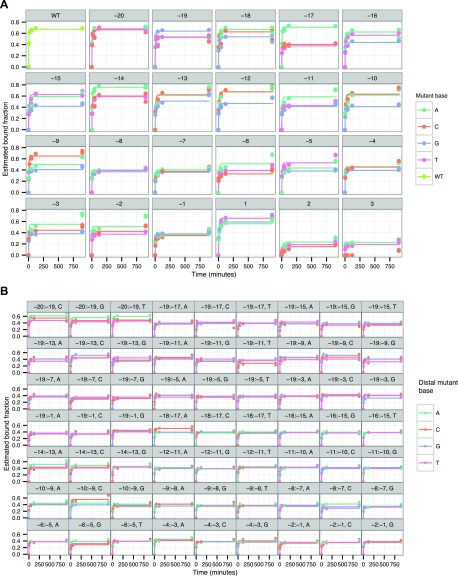
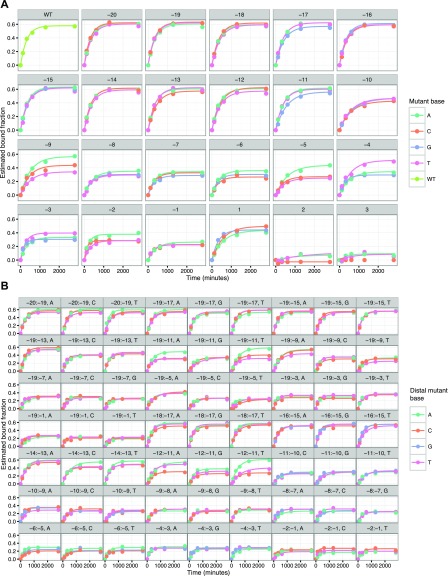
To expand upon these results, we developed a label-free method to study protein–DNA interactions, which we term the massively parallel filter-binding assay (Materials and Methods). By incubating Cas9 with pools of dsDNA libraries, passing the mixture through protein-binding nitrocellulose membranes at set time points, and sequencing the flow-through, we kinetically resolve Cas9 binding of thousands of species simultaneously by examining the depletion of sequencing counts per species from the pool over time. With this approach, we estimated the bound fraction for select time points and generated binding curves for every species (Figs. S6–S8 and SI Text), including all single mismatches plus several double mismatches, for the original λ-target (HiTS-FLIP R2 = 0.746 for single mismatches; Fig. S9A) and two eGFP-derived targets (eGFP site 1 and eGFP site 2) from a study of Cas9 off-target activity (Materials and Methods) (25). Importantly, and in contrast to HiTS-FLIP, these measurements cannot be biased by differential photobleaching across the course of the highly dynamic sgRNA strand invasion process we observe.
Fig. S6.
Massively parallel filter binding of lambda DNA library. Binding curves were fit for (A) nearly all single mutant and (B) select double mutant sequences in an association experiment at 1 nM dCas9.
Fig. S8.
Massively parallel filter binding of eGFP site 2 DNA library. Binding curves were fit for (A) nearly all single mutant and (B) select double mutant sequences in an association experiment at 10 nM dCas9.
Fig. S9.
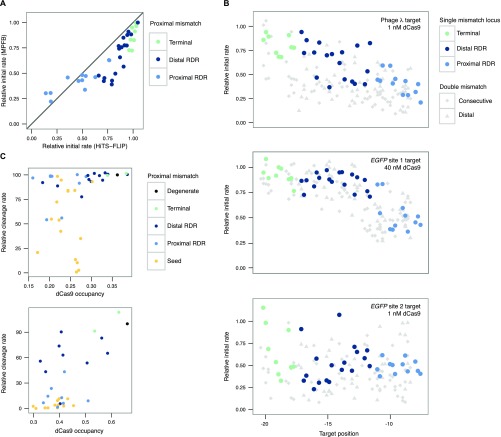
Insights from massively parallel filter binding data. (A) 1 nM data from both HiTS-FLIP and massively parallel filter binding experiments for the λ-target single mutants. The y = x line for perfect agreement is shown. Discordant points are enriched in regions with faster off-rates. (B) The relative initial rate, which we define as kobs times the fit max, plotted for each of the three target libraries at positions relevant for epistasis. Diamonds are double mismatches at consecutive target positions (e.g., a diamond at −18 represents mismatches at positions −17 and −18). Triangles are double mismatches where a proximal mismatch is paired with a distal mismatch at position −19 (e.g., a triangle at −15 represents mismatches at −15 and −19). The original lambda DNA target exhibits widespread negative epistasis. By comparison, the eGFP targets appear to exhibit both positive and negative epistasis. (C) dCas9 occupancy measured at single time points by massively parallel filter binding (10 nM dCas9) versus Cas9 cleavage measured in an eGFP fluorescence assay (25) for a mismatch-insensitive, slow-binding target (eGFP site 1, above), 15 h association, and for a seed mutant-sensitive, fast-binding target (eGFP site 2, below), 45 min association. Occupancy is correlated with reported rates, but seed mutants show lower cleavage rates than expected compared with RDR mutants.
Fig. S7.
Massively parallel filter binding of eGFP site 1 DNA library. Binding curves were fit for (A) nearly all single mutant and (B) select double mutant sequences in an association experiment at 40 nM dCas9.
Consistent with the relative cleavage efficiency data (25), the eGFP site 1 target tolerated numerous mismatches, whereas the eGFP site 2 target proved selective for the on-target sequence (Fig. S9B). For the λ-target and the eGFP site 2 target, we confirmed that after 15 h of association, dCas9 binding could be at least partially reversed after 3 h (the eGFP site 1 target was not profiled owing to its slow binding kinetics). This dissociation was contingent on specific PAM-distal mismatches and generally not impacted by the presence of seed mismatches (Fig. 3B), thereby confirming the presence of an RDR region across gRNA. However, when 10 nM dCas9 was allowed to associate for only 45 min, the dissociation landscape was radically altered, with PAM disruptions and seed mismatches exhibiting equivalent or greater dissociation than PAM-distal mismatches. Furthermore, for the eGFP site libraries, double-mismatch off-targets diverged from their constitutive single-mismatch off-targets in unpredictable ways (Fig. S9B). These results speak to the dynamic and kinetically sensitive nature of the dCas9 strand invasion process. It is clear that although PAM and seed polymorphisms govern initial dCas9 binding kinetics, the contribution of the PAM-distal region cannot be ignored in a full accounting of Cas9 strand invasion. Thus, profiling diverse collections of targets by HiTS-FLIP or massively parallel filter-binding will be crucial for quantifying how base identities and mismatches along the length of the sgRNA modify the kinetics of sgRNA strand invasion across different sequence landscapes.
We also compared dCas9 binding data for the eGFP on-target sequences to in vivo measurements of cleavage efficiency. Although the cleavage data, our simulations, and a model of CRISPRi activity (15) all suggest that the eGFP site 1 target should be highly active, we found that dCas9 bound this target over 100-fold slower than λ-phage target. The cleavage data also suggest that seed mismatches reduce cutting efficiency beyond that anticipated from binding measurements (Fig. S9C). This finding is consistent with a Cas9 conformational gating mechanism (12) that enhances the specificity of cleavage over binding; even when binding is robust, cleavage may be impeded by mismatches.
Drawing from these observations, we propose a mechanism for Cas9 binding and dissociation (Fig. 3C). PAM mutations act to rapidly release diffusing Cas9 molecules postcollision, whereas seed mismatches impair target melting and nucleation. When DNA melting and seed hybridization is accomplished despite seed mismatches, heteroduplex formation can continue to completion, resulting in effectively irreversibly bound Cas9. Mismatches in the nucleotides adjacent to the proximal RDR modulate the energy barrier to dissociation such that heteroduplexes can be reversed on a shorter time scale, especially when multiple PAM-distal mismatches are present. Finally, mismatches in the terminal nucleotides of gRNA-template pairing have little effect in isolation but still destabilize the full heteroduplex and sensitize Cas9 to any additional mismatches in PAM-distal bases.
Our results reveal the complex effects of combinatorial DNA sequence perturbations on the binding behavior of dCas9 across multiple guide sequences and provide powerful tools to further study complex relationships between parameters of guide sequence, target sequence, binding time, and protein concentration, as they relate to both Cas9-mediated binding and cleavage. We identify altered dissociation kinetics as a functional consequence of PAM-distal mismatches in a set of nucleotides we term the reversibility-determining region, which presents across disparate guide sequences. Furthermore, we observe that modulation of Cas9 off-rate kinetics by targeting specific PAM-distal bases represents a potential area for tuning thermodynamic and kinetic behavior of CRISPR/Cas systems for maximal specificity and may already underlie alternate genome editing approaches including truncated gRNAs and modified Cas9 proteins (26–29). More broadly, these results highlight the challenge of predicting dCas9 off-target kinetics and underscore the need for higher resolution temporal data at off-target sites to develop accurate strand invasion models. Such models comprise a starting point for understanding how Cas9-intrinsic behavior is modulated by other factors such as local chromatin accessibility and superhelical density. We anticipate that our approach, together with other, complementary methodologies, promise to extend an avenue of molecular characterization—high-throughput biochemical profiling—that will facilitate functional dissection of novel nucleic acid-binding molecules, in addition to other members of the CRISPR/Cas family of enzymes, at an unprecedented scale.
SI Text
HiTS-FLIP Sequencing Error Quality Control.
Elim Biopharmaceuticals performed single-end sequencing of the library on an Illumina GAIIx sequencer and generated 15,652,121 clusters on one lane of a flow cell. Sequencing consisted of a 15-cycle barcode read followed by a 27-cycle target read. To ensure proper cluster assignment in subsequent kinetic profiling on the flow cell, clusters not passing filter were included in downstream image analyses. To improve barcode mapping accuracy, the library was also sequenced on an Illumina HiSeq sequencer by Elim Biopharmaceuticals. The 2 × 50 paired-end sequencing was performed with the same barcode read primer and a paired-end target read primer to free the index read. This yielded 43,617,449 total reads for mapping barcode sequences to target sequences.
Sequencing data from both the GAIIx and HiSeq sequencing runs were combined to obtain maximum accuracy in determining the sequence identity of dCas9 templates. Target reads from both runs were trimmed to the first 23 bases (the length of the doped target sequence). GAIIx target reads were reverse-complemented to match the orientation of the HiSeq target reads. The HiSeq barcode read was trimmed to the first 15 bases (the length of the barcode). Thus, each cluster could be summarized by cluster ID, barcode read, barcode read q scores, target read, and target read q scores.
To ensure high sequencing quality, a barcode-target dictionary was generated in a base-wise manner: For each position in the 23-bp target sequence, the most common base across the barcode’s clusters was taken as the true base. After this, each barcode was annotated with (i) the consensus target sequence, (ii) the number of clusters attributed to the barcode, and (iii) what proportion of target reads matched the consensus target sequence.
Data from a barcode were removed from downstream analysis if they (i) had fewer than four clusters informing the mapping, (ii) surpassed the mean number of clusters per barcode by 2 SDs, (iii) represented a homopolymer, (iv) aligned to the Illumina adapter sequence, or (v) had under 50% of contributing cluster target reads perfectly matching the consensus target read. The remaining barcodes were considered high quality and their consensus target sequences were considered the correct target sequence for that barcode.
Library Design.
The DNA library was constructed from two DNA oligos synthesized by the Stanford Protein and Nucleic Acid Facility. One DNA oligo contained Illumina P7 sequence, a 15-base randomer to serve as a unique molecular identifier barcode, and custom sequencing primer cspLC 01. The second DNA oligo contained Illumina P5 sequence, custom sequencing primer cspLC 02, and the doped lambda 1 dCas9–sgRNA target binding site. Degenerate bases were introduced using hand-mixed bases with a 76% chance of incorporating the sgRNA on-target base and an 8% chance of incorporating each alternative base. The degeneracy was optimized with the intent to cover all double mutants.
Library Assembly.
Libraries were assembled by annealing two partially overlapping oligos and extending with Phusion HF polymerase (NEB) to generate double-stranded library members. Excess single-stranded oligos were digested with ExoI (NEB). The number of full-length molecules in each library was then quantified by qPCR, and the population of each library was bottlenecked to ∼950,000 unique molecules, each of which could be identified by its unique 15-base barcode. This bottlenecked library was then amplified to 30 nM by PCR and quantified as previously described (17).
Sequence data are available at the Sequence Read Archive under the BioProject accession no. PRJNA326138.
Flow Cell Preparation.
Following sequencing, the GAIIx flow cell was placed on a GAIIx sequencer modified as previously described (17). The second strand of DNA generated during sequencing was stripped with formamide, and the residual fluorophores from sequencing were cleaved with cleavage buffer (100 mM TCEP, 100 mM Tris, pH 8.0, 125 mM NaCl, and 0.05% Tween 20).
HiTS-FLIP Experimental Details.
Following dsDNA generation, the loaded dCas9–sgRNA was perfused over the flow cell. The lane containing the dCas9 target library was imaged for ∼25 min following the initial perfusion, 4 min per 120-tile image series plus pauses between series. dCas9–sgRNA was replenished at varying intervals, with no changes in observed on-rates as a result of this at the time scales investigated. Labeled sgRNA was confirmed to yield no quantifiable association signal on the flow cell surface in the absence of dCas9, so excess sgRNA was used to ensure that all dCas9 molecules bound sgRNA.
After ∼12 h of dCas9 perfusion, another image series was taken to confirm saturation of binding of dCas9 on the DNA clusters. Following this series, we performed the dissociation experiments. In one experiment, 250 nM unlabeled competitor on-target dsDNA in binding buffer was introduced into the flow cell to replace the dCas9 solution. The on-target acts as a competitor to prevent soluble dCas9–sgRNA from rebinding clusters on the surface after dissociation. In the passive flow experiment, binding buffer without target DNA was used instead.
HiTS-FLIP Data-Processing Quality Control.
The time for the Illumina GAIIx to perfuse new solution over the flow cell and take the next image was found to be consistent across runs and enabled determination of how long dCas9 participated in binding before the first image was taken; however, we suspected that the high local concentration of DNA in flow cell clusters, the possibility of protein aggregation over time, and a nontrivial rate of photobleaching per image (estimated to be ∼2% from consecutive imaging) could confound results over time. Therefore, we limited the time scale of each experiments to three informative image series, which should be relatively unimpaired by these biases.
To account for systematic differences in focus, cluster formation efficiency, and illumination across tiles, fluorescence values were normalized per tile for on-rates by dividing them by the median quantified fluorescence among the on-target clusters in the postsaturation images collected 12 h after the initial perfusion. High background clusters were filtered out if their first quantified value exceeded 2% of the saturated signal for on-target binding, below which clusters exhibited signal even in the absence of a GG dinucleotide.
Before calculating off-rates per sequence, clusters’ quantified fluorescence values were normalized. First, data at each time point were normalized by the on-target median fluorescence at that time. This accounts for additional variation in signal assuming that dissociation of dCas9 from its canonical target is negligible in the first 30 min and in practice amounts to a small adjustment. Next, each cluster’s intensities were normalized by the first data point in the dissociation series such that corrected values represented the proportional decrease in fluorescence signal. DNA sequences with a median intensity for the first data point below 30% that of the on-target signal were excluded to filter out noisy fits.
GG dinucleotides in oligo library barcodes and Illumina adapters as well as nonspecific deposition could confound study of PAM recognition and very low-level binding, so off-targets were filtered out if they failed to reach 2% of the saturated signal for the majority of their corresponding clusters.
Materials and Methods
dCas9 and sgRNA Preparation.
dCas9 (the catalytically dead D10A/H840A mutant) was purified as described (20). The sgRNA (SI Text) was in vitro transcribed from the BamHI cleavage product of pSHS 256 (https://benchling.com/s/zmUR5HNi/edit) using T7 polymerase. The 3′ end of the sgRNA was extended to permit annealing of the Cy3 probe. Both the 3′ extension and hybridized Cy3 probe were loaded into dCas9 and tested on on-target DNA to ensure no defect in Cas9 binding resulted.
Association and Dissociation HiTS-FLIP Experiments.
The 3′ end of the sgRNA was labeled before loading onto dCas9 with a Cy3-labeled oligo (SI Text) by incubating 4.95 μM sgRNA with 5 µM of the labeled oligo in hybridization buffer (20 mM Tris∙HCl, pH 7.5, 100 mM KCl, 5 mM MgCl2) for 5 min at 95 °C and then slowly cooling to room temperature. For each experiment (1 nM and 10 nM dCas9), the specified concentration of dCas9 was incubated with 50 nM labeled sgRNA at 37 °C for 25 min in binding buffer (20 mM Tris∙HCl, pH 7.5, 100 mM KCl, 5 mM MgCl2, 5% glycerol, 0.05 mg/mL heparin, 1 mM DTT, and 0.005% Tween 20) to load the sgRNA onto the dCas9. Each loaded dCas9–sgRNA preparation was placed on ice throughout the course of the experiment.
Before each association and dissociation experiment, any DNA hybridized to the DNA tethered on the flow cell surface in a previous experiment was removed with a 100 mM NaOH solution. Next, an Alexa 647-labeled oligo (SI Text) was annealed to a common sequence on the tethered DNA. dsDNA was generated by extending the annealed oligo with Klenow Fragment (3′→ 5′ exo-) (NEB) in buffer, per the manufacturer’s recommendations, for 30 min at 37 °C.
HiTS-FLIP Data Processing.
Raw images were processed using software previously described (1–3, 7, 16, 17). Time stamps were extracted from image file metadata to assign the exact time the data were recorded. Initial on-rates were calculated by performing linear regression on the quantified fluorescence values across all clusters, constraining the fit to go through the origin. To permit joint analysis of 1 and 10 nM datasets, linear regression was performed on target sequences quantified for both concentrations, and 10 nM slopes absent in the 1 nM dataset due to the limits of detection were inferred from the fit line (Fig. S1A).
Initial off-rates were also calculated by linear regression but without constraining the intercept. For both on- and off-rates, SEs and confidence intervals were calculated by bootstrapping the clusters used in linear regression 100 times.
See SI Text for extended methods. Fit values are available for both 10-nM (Datasets S1–S4) and 1-nM (Datasets S5–S6) data.
Radioactive Filter-Binding Experiments.
DNA targets identical in sequence to the flow cell clusters were selected, using the most common barcode for each off-target. Six targets (on-target, −16G, −16T, −13C, −5T, and +3A) were ordered as gBlocks from IDT (SI Text), amplified by PCR, and gel purified. The dsDNA was then 5′ radiolabeled by incubating 150 nM dsDNA, 1x T4 PNK (NEB), 1x PNK buffer (NEB), and 1 µM [γ- 32P]-ATP (PerkinElmer) for 30 min at 37 °C followed by purification with a nucleotide removal kit (Qiagen). The sgRNA was hybridized to a labeled DNA oligo, as described above, and loaded onto the dCas9 by incubating 100 nM dCas9 and 125 nM sgRNA at 37 °C for 25 min and then at <4 °C.
Association rates were measured by incubating radiolabeled DNA targets with loaded dCas9 for different durations in a binding buffer identical to the flow cell experiments (see Association and Dissociation HiTS-FLIP Experiments). The total volume was 30 µL, and the concentrations were either 10 nM dCas9 and <240 pM DNA, or 1 nM dCas9 and <150 pM DNA. For dissociation measurements, 10 nM dCas9 and <240 pM target DNA were incubated for 2 h (on-target, −16G, −16T, −13C, and +3A) or 5 h (−5T) followed by the addition of 6 µL nonradiolabeled cold competitor DNA in binding buffer (final concentration, 83 nM; see Table S1). The quenching step lasted for different durations, and both association and dissociation experiments were timed such that all conditions finished at nearly the same time. The samples were then applied to a 96-well Bio-Dot microfiltration blotting apparatus under low vacuum, passing through a nitrocellulose membrane (Amersham Hybond ECL, GE Healthcare Life Sciences), a nylon membrane (Biodyne B, 0.45 µM, Thermo Scientific), and a filter paper (GE Healthcare Life Sciences) that were all pre-equilibrated with binding buffer. The membranes were allowed to dry, transferred to a phosphor screen overnight, and then measured on a Typhoon imager (GE Healthcare Life Sciences). Images were quantified in TotalLab Quant v12.2, and the dCas9-bound DNA fraction was calculated as the signal from the nitrocellulose membrane divided by the total signal from the both the nitrocellulose and nylon membranes.
Table S1.
Sequences for Gel Shift and Filter-Binding Assays
| Item | Name | Sequence |
| 1 | sgRNA | GACGCAUAAAGAUGAGACGCGUUUUAGAGCUAUGCUGUUUUGGAAACAAAACAGCAUAGCAAGUUAAAAUAAGGCUAGUCCGUUAUCAACUUGAAAAAGUGGCACCGAGUCGGUGCUUUUUUUGCUCGUGCGCUGGAUC |
| 2 | sgRNA_probe_Cy3 | /5Cy3/AAGATCCAGCGCACGAGCAA |
| 3 | Flow_cell_probe_Alexa647 | /5Alex647N/TCTACACATCGATGTGCATTGAACGAT |
| 4 | Cas9_WT_array_construct | CAAGCAGAAGACGGCATACGAGAT AAGGGGCGAGTTGAT TGAAATGCTTGCGACTTACGAGTGCTATGCGACTGCACAGCAGAAATCTCTGCT CCAGCGTCTCATCTTTATGCGTC AGTACAAACGTCAGCATCGTTCAATGCACATCGATGTGTAGATCTCGGTGGTCGCCGTATCATT |
| 5 | Cas9_−16G_array_construct | CAAGCAGAAGACGGCATACGAGAT TGAAGGCGTAATATT TGAAATGCTTGCGACTTACGAGTGCTATGCGACTGCACAGCAGAAATCTCTGCT CCAGCGTCTCATCTTTATCCGTC AGTACAAACGTCAGCATCGTTCAATGCACATCGATGTGTAGATCTCGGTGGTCGCCGTATCATT |
| 6 | Cas9_−16T_array_construct | CAAGCAGAAGACGGCATACGAGAT GGGCATTCAACTCCG TGAAATGCTTGCGACTTACGAGTGCTATGCGACTGCACAGCAGAAATCTCTGCT CCAGCGTCTCATCTTTATACGTC AGTACAAACGTCAGCATCGTTCAATGCACATCGATGTGTAGATCTCGGTGGTCGCCGTATCATT |
| 7 | Cas9_−13C_array_construct | CAAGCAGAAGACGGCATACGAGAT TCGTTTGGAAAACCT TGAAATGCTTGCGACTTACGAGTGCTATGCGACTGCACAGCAGAAATCTCTGCT CCAGCGTCTCATCTTGATGCGTC AGTACAAACGTCAGCATCGTTCAATGCACATCGATGTGTAGATCTCGGTGGTCGCCGTATCATT |
| 8 | Cas9_−5T_array_construct | CAAGCAGAAGACGGCATACGAGAT GGCGCCGCAGCATCA TGAAATGCTTGCGACTTACGAGTGCTATGCGACTGCACAGCAGAAATCTCTGCT CCAGCGTATCATCTTTATGCGTC AGTACAAACGTCAGCATCGTTCAATGCACATCGATGTGTAGATCTCGGTGGTCGCCGTATCATT |
| 9 | Cas9_+3A_array_construct | CAAGCAGAAGACGGCATACGAGAT ATCAGCTTTGGCGTA TGAAATGCTTGCGACTTACGAGTGCTATGCGACTGCACAGCAGAAATCTCTGCT TCAGCGTCTCATCTTTATGCGTC AGTACAAACGTCAGCATCGTTCAATGCACATCG ATGTGTAGATCTCGGTGGTCGCCGTATCATT |
| 10 | C_adapter | AATGATACGGCGACCACCGAGATCTACAC |
| 11 | D_adapter | CAAGCAGAAGACGGCATACGAGAT |
| 12 | D_adapter_Cy5 | /5Cy5/CAAGCAGAAGACGGCATACGAGAT |
EMSA Experiments.
Cy5-labeled DNA targets were generated by PCR. To measure association rates, DNA was incubated with loaded dCas9 for varying times followed by a quench step with a high concentration of unlabeled competitor on-target DNA. Sequences and binding buffer were identical to the filter binding experiments (Table S1 for DNA sequences). Concentrations were 100 pM DNA, 1 nM dCas9, and 80 nM competitor for the on-target target and 400 pM DNA, 10 nM dCas9, and 100 nM competitor for the −5T off-target. Following the quench, samples were resolved by gel electrophoresis on a 10% native polyacrylamide gel (Mini-PROTEAN, Bio-Rad) in TBE running buffer (Bio-Rad) for 30–60 min at 120 V at 4 °C. Gels were imaged on a Typhoon imager (GE Healthcare Life Sciences) and quantified in TotalLab Quant v12.2.
Kinetic Monte Carlo Simulations.
Simulations were carried out as in Josephs et al. (22), with additional parameterization. The full strand invasion of dCas9 was modeled as a series of 21 discrete states, where the first state was fully dissociated dCas9, the second state represented PAM binding, and the subsequent 19 states reflected successive strand invasion from 2 to 20 bp of RNA–DNA heteroduplex. The initial on-rate and the free energy of PAM binding were left as free parameters. Mismatches were modeled as increases in the free energy of states following the position of the mismatch, one value for transitions and one for transversions, which was supported by the data. Simulations were compared with data by assuming that HiTS-FLIP measurements corresponded to the fraction of DNA molecules in the bound states (states 2–21). One thousand kinetic Monte Carlo simulations were performed at a time to model clusters on the Illumina flow cell. Simulations were run until 30% (300) of the DNA molecules were in the bound states. Results were robust to choice of threshold. To enable a better fit of the model to the data, a free energy term representing protein conformational change was added at a state that was also set as a free parameter. The six parameters above were optimized by grid search across all single-mutant on-rates from the 1 nM dCas9 HiTS-FLIP experiment. The simulation script and accompanying information are available in Datasets S7–S9.
Massively Parallel Filter-Binding Experiments.
Oligos corresponding to every individual position and select pairs of positions were column-synthesized (IDT) for three targets, the original lambda DNA and two eGFP targets. For each oligo’s target positions, the three nonreference bases were mixed and incorporated. Oligos were pooled by target followed by PCR to generate dsDNA with extended sequencing adapters. Competitor DNA with the same on-target sequence but with alternate PCR adapters was similarly generated.
Experiments were carried out at 1 nM and 10 nM dCas9 in 450-µL reaction volumes containing 100 pM target pools and 10% excess sgRNA (EnGen sgRNA Synthesis Kit, NEB). dCas9 and targets were incubated at set time points before being loaded into a 1 mL syringe attached to a 0.45 µm pore size, 25 mm diameter nitrocellulose syringe filter (GVS). For dissociation experiments, at the end of the corresponding association experiment, dCas9 was quenched with 20 nM competitor DNA and allowed to sit for 3 h. Flow-through from each time point was amplified by PCR using unique barcodes and sequenced. Counts were normalized both to the starting time point (controlling for DNA input) and to nonbinding DNA in the experiment (representing 0% bound). For association experiments, binding curves were fit as single exponentials using the nls function in R. For dissociation curves, the normalized dissociation signal was compared with the corresponding association data point to calculate the fraction dissociated.
Sequence data are available at SRA accession no. SRP102425.
Supplementary Material
Acknowledgments
We thank members of the W.J.G. laboratory for feedback on data visualization. This work was supported by grants from the Beckman Foundation, the Human Frontiers Science Program, and National Institutes of Health Grants 5R01GM111990, 1P50HG00773501, UM1HG009436, and 3P01GM066275 (to W.J.G.). W.J.G acknowledges support as a Chan-Zuckerberg Investigator. E.A.B. acknowledges support from NIH Training Grant 5T32HG000044-19. L.M.C. acknowledges support from NIH Training Grant T32GM067586 and the National Science Foundation graduate research fellowship program (NSF-GRFP). M.J.W. and E.A.B. also acknowledge support from the NSF-GRFP. J.A.D. acknowledges support from the National Science Foundation (Grant MCB-1244557 to J.A.D.). J.A.D. is an investigator of the Howard Hughes Medical Institute.
Footnotes
Conflict of interest statement: S.H.S. is an employee of Caribou Biosciences, Inc. and an inventor on patents and patent applications related to CRISPR-Cas systems and applications thereof. J.A.D. is a cofounder of Editas Medicine, Intellia Therapeutics, and Caribou Biosciences and a scientific advisor to Caribou, Intellia, eFFECTOR Therapeutics, and Driver. J.A.D. receives funding from Roche, Pfizer, the Paul Allen Institute, and the Keck Foundation.
This article is a PNAS Direct Submission. S.B. is a guest editor invited by the Editorial Board.
Data deposition: The sequences reported in this paper have been deposited in Sequence Read Archive database (accession nos. SRP102425 and SRP076741).
This article contains supporting information online at www.pnas.org/lookup/suppl/doi:10.1073/pnas.1700557114/-/DCSupplemental.
References
- 1.Anders C, Niewoehner O, Duerst A, Jinek M. Structural basis of PAM-dependent target DNA recognition by the Cas9 endonuclease. Nature. 2014;513:569–573. doi: 10.1038/nature13579. [DOI] [PMC free article] [PubMed] [Google Scholar]
- 2.Mojica FJM, Díez-Villaseñor C, García-Martínez J, Almendros C. Short motif sequences determine the targets of the prokaryotic CRISPR defence system. Microbiology. 2009;155:733–740. doi: 10.1099/mic.0.023960-0. [DOI] [PubMed] [Google Scholar]
- 3.Wang H, La Russa M, Qi LS. CRISPR/Cas9 in genome editing and beyond. Annu Rev Biochem. 2016;85:227–264. doi: 10.1146/annurev-biochem-060815-014607. [DOI] [PubMed] [Google Scholar]
- 4.Sternberg SH, Redding S, Jinek M, Greene EC, Doudna JA. DNA interrogation by the CRISPR RNA-guided endonuclease Cas9. Nature. 2014;507:62–67. doi: 10.1038/nature13011. [DOI] [PMC free article] [PubMed] [Google Scholar]
- 5.Szczelkun MD, et al. Direct observation of R-loop formation by single RNA-guided Cas9 and Cascade effector complexes. Proc Natl Acad Sci USA. 2014;111:9798–9803. doi: 10.1073/pnas.1402597111. [DOI] [PMC free article] [PubMed] [Google Scholar]
- 6.Duan J, et al. Genome-wide identification of CRISPR/Cas9 off-targets in human genome. Cell Res. 2014;24:1009–1012. doi: 10.1038/cr.2014.87. [DOI] [PMC free article] [PubMed] [Google Scholar]
- 7.Fu BXH, Hansen LL, Artiles KL, Nonet ML, Fire AZ. Landscape of target:guide homology effects on Cas9-mediated cleavage. Nucleic Acids Res. 2014;42:13778–13787. doi: 10.1093/nar/gku1102. [DOI] [PMC free article] [PubMed] [Google Scholar]
- 8.Pattanayak V, et al. High-throughput profiling of off-target DNA cleavage reveals RNA-programmed Cas9 nuclease specificity. Nat Biotechnol. 2013;31:839–843. doi: 10.1038/nbt.2673. [DOI] [PMC free article] [PubMed] [Google Scholar]
- 9.Wu X, et al. Genome-wide binding of the CRISPR endonuclease Cas9 in mammalian cells. Nat Biotechnol. 2014;32:670–676. doi: 10.1038/nbt.2889. [DOI] [PMC free article] [PubMed] [Google Scholar]
- 10.Kuscu C, Arslan S, Singh R, Thorpe J, Adli M. Genome-wide analysis reveals characteristics of off-target sites bound by the Cas9 endonuclease. Nat Biotechnol. 2014;32:677–683. doi: 10.1038/nbt.2916. [DOI] [PubMed] [Google Scholar]
- 11.Hsu PD, et al. DNA targeting specificity of RNA-guided Cas9 nucleases. Nat Biotechnol. 2013;31:827–832. doi: 10.1038/nbt.2647. [DOI] [PMC free article] [PubMed] [Google Scholar]
- 12.Sternberg SH, LaFrance B, Kaplan M, Doudna JA. Conformational control of DNA target cleavage by CRISPR-Cas9. Nature. 2015;527:110–113. doi: 10.1038/nature15544. [DOI] [PMC free article] [PubMed] [Google Scholar]
- 13.Jiang F, et al. Structures of a CRISPR-Cas9 R-loop complex primed for DNA cleavage. Science. 2016;351:867–871. doi: 10.1126/science.aad8282. [DOI] [PMC free article] [PubMed] [Google Scholar]
- 14.O’Geen H, Henry IM, Bhakta MS, Meckler JF, Segal DJ. A genome-wide analysis of Cas9 binding specificity using ChIP-seq and targeted sequence capture. Nucleic Acids Res. 2015;43:3389–3404. doi: 10.1093/nar/gkv137. [DOI] [PMC free article] [PubMed] [Google Scholar]
- 15.Xu H, et al. Sequence determinants of improved CRISPR sgRNA design. Genome Res. 2015;25:1147–1157. doi: 10.1101/gr.191452.115. [DOI] [PMC free article] [PubMed] [Google Scholar]
- 16.Nutiu R, et al. Direct measurement of DNA affinity landscapes on a high-throughput sequencing instrument. Nat Biotechnol. 2011;29:659–664. doi: 10.1038/nbt.1882. [DOI] [PMC free article] [PubMed] [Google Scholar]
- 17.Buenrostro JD, et al. Quantitative analysis of RNA-protein interactions on a massively parallel array reveals biophysical and evolutionary landscapes. Nat Biotechnol. 2014;32:562–568. doi: 10.1038/nbt.2880. [DOI] [PMC free article] [PubMed] [Google Scholar]
- 18.Jiang W, Bikard D, Cox D, Zhang F, Marraffini LA. RNA-guided editing of bacterial genomes using CRISPR-Cas systems. Nat Biotechnol. 2013;31:233–239. doi: 10.1038/nbt.2508. [DOI] [PMC free article] [PubMed] [Google Scholar]
- 19.Zhang Y, et al. Comparison of non-canonical PAMs for CRISPR/Cas9-mediated DNA cleavage in human cells. Sci Rep. 2014;4:5405. doi: 10.1038/srep05405. [DOI] [PMC free article] [PubMed] [Google Scholar]
- 20.Jinek M, et al. A programmable dual-RNA-guided DNA endonuclease in adaptive bacterial immunity. Science. 2012;337:816–821. doi: 10.1126/science.1225829. [DOI] [PMC free article] [PubMed] [Google Scholar]
- 21.Fu Y, Sander JD, Reyon D, Cascio VM, Joung JK. Improving CRISPR-Cas nuclease specificity using truncated guide RNAs. Nat Biotechnol. 2014;32:279–284. doi: 10.1038/nbt.2808. [DOI] [PMC free article] [PubMed] [Google Scholar]
- 22.Josephs EA, et al. Structure and specificity of the RNA-guided endonuclease Cas9 during DNA interrogation, target binding and cleavage. Nucleic Acids Res. 2016;44:2474. doi: 10.1093/nar/gkv1293. [DOI] [PMC free article] [PubMed] [Google Scholar]
- 23.Singh D, Sternberg SH, Fei J, Doudna JA, Ha T. Real-time observation of DNA recognition and rejection by the RNA-guided endonuclease Cas9. Nat Commun. 2016;7:12778. doi: 10.1038/ncomms12778. [DOI] [PMC free article] [PubMed] [Google Scholar]
- 24.Farasat I, Salis HM. A biophysical model of CRISPR/Cas9 activity for rational design of genome editing and gene regulation. PLOS Comput Biol. 2016;12:e1004724. doi: 10.1371/journal.pcbi.1004724. [DOI] [PMC free article] [PubMed] [Google Scholar]
- 25.Fu Y, et al. High-frequency off-target mutagenesis induced by CRISPR-Cas nucleases in human cells. Nat Biotechnol. 2013;31:822–826. doi: 10.1038/nbt.2623. [DOI] [PMC free article] [PubMed] [Google Scholar]
- 26.Kleinstiver BP, et al. High-fidelity CRISPR-Cas9 nucleases with no detectable genome-wide off-target effects. Nature. 2016;529:490–495. doi: 10.1038/nature16526. [DOI] [PMC free article] [PubMed] [Google Scholar]
- 27.Oakes BL, et al. Profiling of engineering hotspots identifies an allosteric CRISPR-Cas9 switch. Nat Biotechnol. 2016;34:646–651. doi: 10.1038/nbt.3528. [DOI] [PMC free article] [PubMed] [Google Scholar]
- 28.Slaymaker IM, et al. Rationally engineered Cas9 nucleases with improved specificity. Science. 2016;351:84–88. doi: 10.1126/science.aad5227. [DOI] [PMC free article] [PubMed] [Google Scholar]
- 29.Nihongaki Y, Kawano F, Nakajima T, Sato M. Photoactivatable CRISPR-Cas9 for optogenetic genome editing. Nat Biotechnol. 2015;33:755–760. doi: 10.1038/nbt.3245. [DOI] [PubMed] [Google Scholar]
Associated Data
This section collects any data citations, data availability statements, or supplementary materials included in this article.


