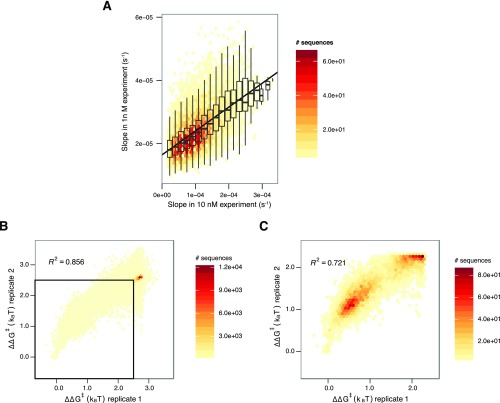
Fig. S1.
Merging of datasets and reproducibility of on-rates for 1 and 10 nM experiments. (A) The initial apparent on-rates from 10 nM data were extrapolated into apparent on-rates expected from 1 nM using a line fit to the on-rates for different sequences, shown above in scatter plot. The slope of the fit line is 0.076 (i.e., on-rates in the 1 nM data were 7.6% of that seen in the 10 nM data). Both differential protein loss in the microfluidic lines and pipetting error may explain the deviation from the expected 10%. (B) All mutant sequences are shown in this scatter plot. Most sequences are concentrated in the upper right, likely corresponding to PAM recognition kinetics. (C) Zooming into the indicated square in A highlights more than marginal binding. Sequences with high error in on-rate estimates (corresponding to 2% of sequences fit with on-rates) were removed before calculating correlations.

