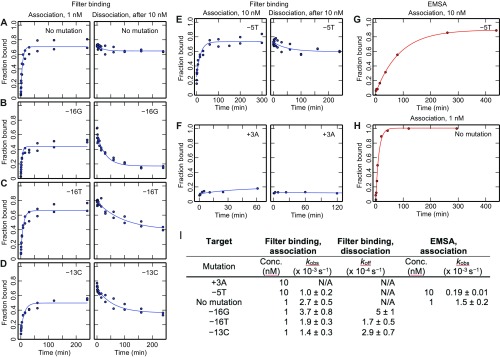
Fig. S4.
In-solution characterization of dCas9 association and dissociation. (A–F). Filter-binding measurements of association for the on-target sequence and five single mismatch targets. For dissociation, DNA was first incubated with 10 nM dCas9, and data represent time after quench with competitor DNA. (G and H) Gel shift measurement of association for the perfect target and the −5T mutant. (I) Observed kinetic on-rates, kobs, and off-rates, koff, from fits to the data. Association curves were fit to a first-order reversible binding reaction [f = (fmax − fmin)(1− exp(−kobs t))+ fmin] and dissociation curves to an exponential decay [f = (fmax − fmin)(exp(−koff t))+ fmin], where t is time and fmax and fmin are the minimum and maximum signals, respectively. The “No mutation” and −5T targets did not dissociate sufficiently for accurate quantification, and the +3 target did not show appreciable binding after 60 min in the filter assay. Conc, concentration.

