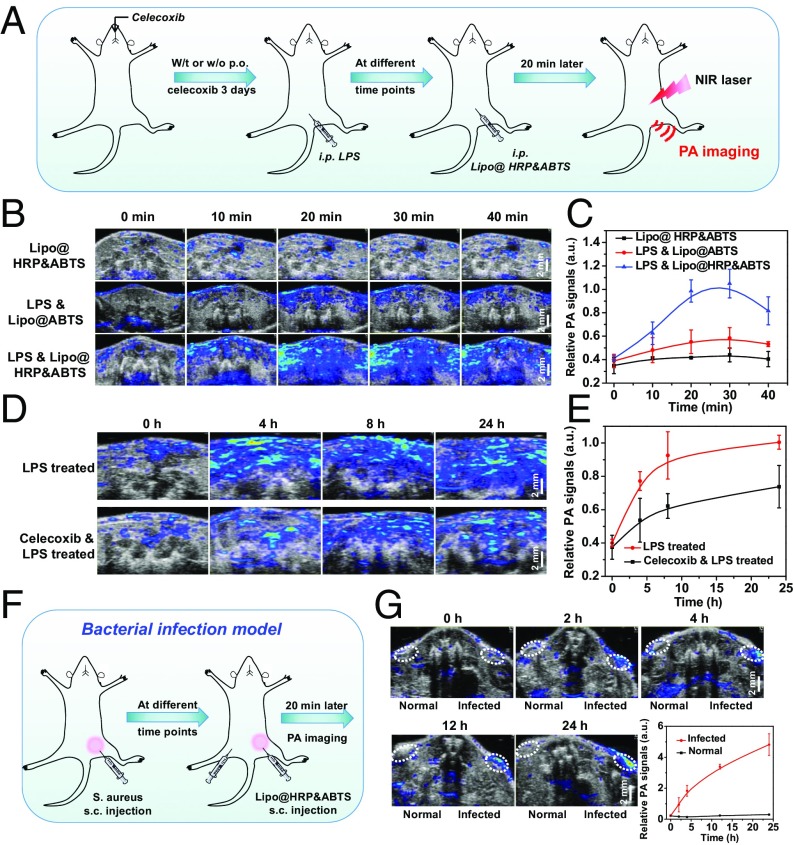
Fig. 2.
PA imaging for in vivo inflammation detection with Lipo@HRP&ABTS. (A) Schematic illustration showing PA imaging of LPS-induced inflammation with Lipo@HRP&ABTS as the nanoprobe. Some of the mice were administrated per os (p.o.) with celecoxib at 3 d, 2 d, 1 d, and 2 h before LPS injection. At different time points after LPS injection, mice were i.p. injected with Lipo@HRP&ABTS for PA imaging. (B) In vivo PA images of mouse abdomen at 24 h after injection of LPS to induce inflammation with i.p. injection of Lipo@HRP&ABTS or Lipo@ABTS. (C) PA signals at 800 nm for mouse abdomen based on PA imaging data in B. (D and E) In vivo PA images (D) and PA signals at 800 nm (E) in mouse abdomen with or without oral feeding of celecoxib taken at different time points after i.p. injection of LPS. (F) Schematic illustration showing the detection of inflammation induced by bacteria with Lipo@HRP&ABTS by PA imaging. (G) In vivo PA images and PA signals at 800 nm of mice with bacterial infection after injection of Lipo@HRP&ABTS. The infected regions and normal regions with injection of Lipo@HRP&ABTS are highlighted in dashed circles. Three mice were measured in each group in B–G. Data are presented as the mean ± SEM.

