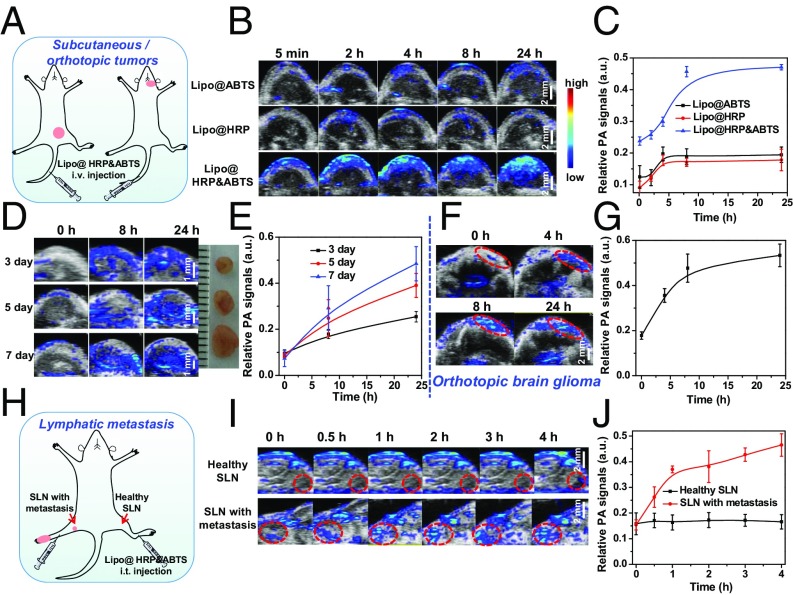
Fig. 3.
PA imaging for in vivo tumor detection with Lipo@HRP&ABTS. (A) Schematic illustration of PA imaging on the s.c. tumor model and orthotopic brain glioma after i.v. injection of Lipo@HRP&ABTS. (B) In vivo PA images of 4T1 tumor-bearing mice taken at different time points after i.v. injection of Lipo@ABTS, Lipo@HRP, or Lipo@HRP&ABTS. (C) Relative PA signal intensities in tumors from different groups of mice at various time intervals based on PA imaging data shown in B. (D) In vivo PA images of mice bearing 4T1 tumors at different stages after i.v. injection of Lipo@HRP&ABTS. (Inset) A photo of these tumors. (E) Relative PA signal intensities in tumors at different stages based on PA imaging data shown in D. (F and G) In vivo PA images (F) and PA signals at 800 nm (G) in mice with orthotopic brain glioma tumors after i.v. injection of Lipo@HRP&ABTS. (H) Schematic illustration of PA imaging on the lymphatic metastasis tumor model. (I) In vivo PA images of SLNs with or without metastasis taken at different time points after injection of Lipo@HRP&ABTS. SLNs are highlighted by dashed circles in those images. (J) Relative PA signal intensities in SLNs at various time intervals based on PA imaging data shown in I. Three mice were measured in each group in B–J. Data are presented as the mean ± SEM.

