
FIGURE 3.
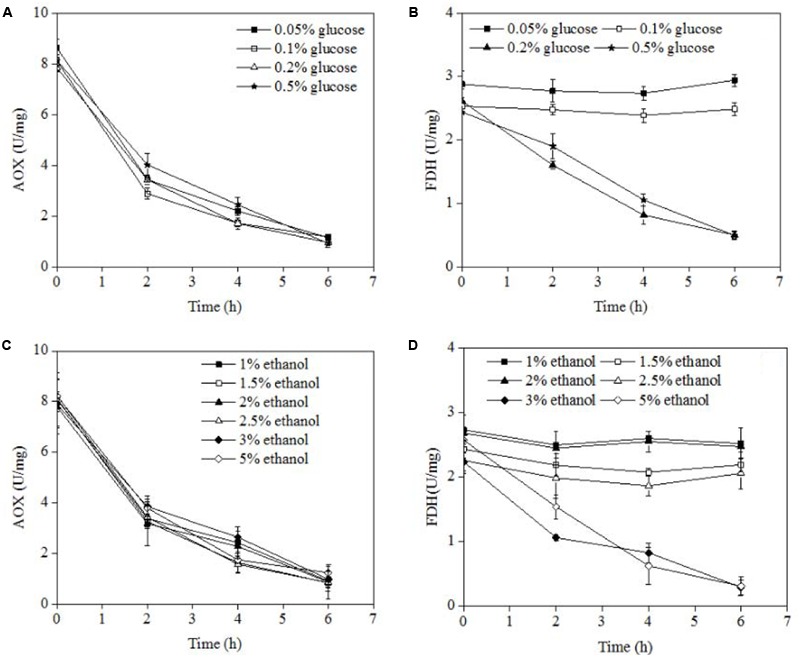
AOX and FDH activities in P. pastoris cells at different concentrations of various carbon sources. (A) AOX activities of P. pastoris cells when carbon source was switched from 0.5% methanol to different concentrations of glucose. (B) FDH activities of P. pastoris cells when carbon source was switched from 0.5% methanol to different concentrations of glucose. (C) AOX activities of P. pastoris cells when carbon source was switched from 0.5% methanol to different concentrations of ethanol. (D) AOX activities of P. pastoris cells when carbon source was switched from 0.5% methanol to different concentrations of ethanol.