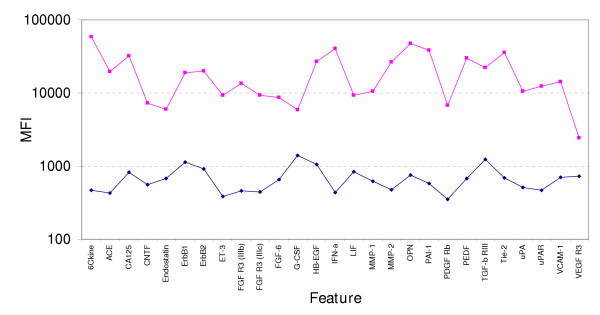
Figure 7.
New array validation. Stress testing at 50X MDL analyte concentration. The pink line reveals the specific MFI signal for each analyte at 50X MDL in the presence of all detectors (n × n). The blue line shows the signal for each analyte under conditions where all analytes are added at 50X MDL along with all detector antibodies minus the cognate detector antibody (n × (n-1)) to reveal non-specific signal contributed by non-cognate detectors.

