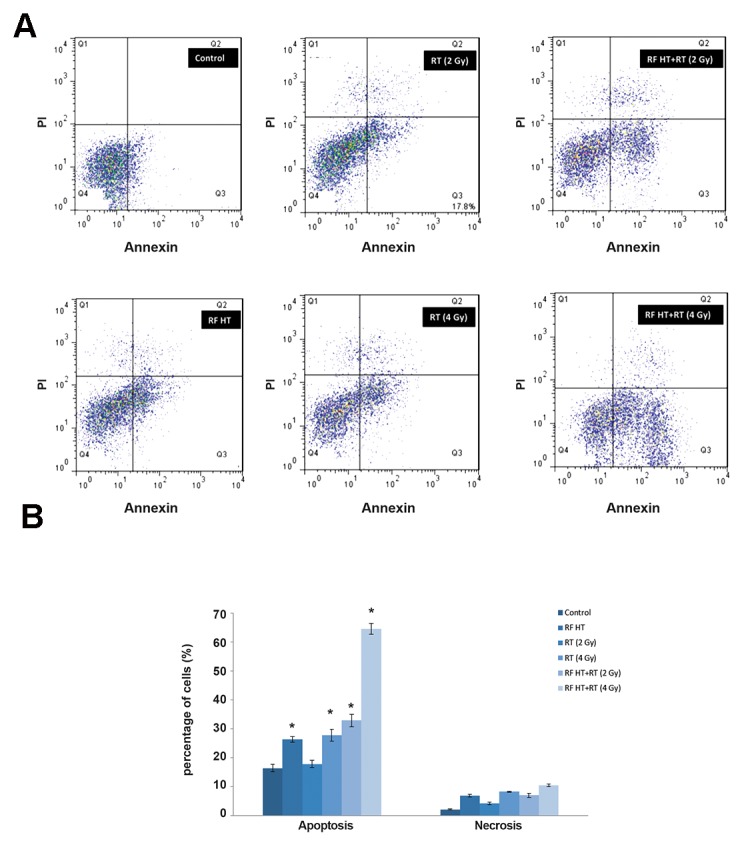
Fig.5.

Analysis of apoptosis and necrosis in DU145 cells. A. BD FACSCalibur analysis of the apoptotic and necrotic cells using annexin V/PI one hour after cells were either exposed to radiofrequency hyperthermia (RF HT) at 43˚C for 90 minutes and radiation (RT) at 2 or 4 Gy of 15 MV X-rays; or the combination of HT and radiation (RF HT+RT) at 2Gy or 4 Gy. Annexin V/PI staining with FacScan dot plot analysis were used to divide the treated and control cells into four groups: Q1: percentage of necrotic cells, Q2: percentage of late apoptotic cells, Q3: percentage of early apoptotic cells, and Q4: percentage of living cells and B. Statistical analysis of percentage of apoptosis and necrosis of human prostate tumor cell line, DU 145, one hour after RF HT, RT, RF HT+RT (2 Gy), and RF HT+RT (4 Gy). Statistical analysis of the data obtained from flow cytometry analysis showed significant differences compared to the control group, marked with * (P<0.05) (means ± SEM of three experiments).
