
Figure 2.
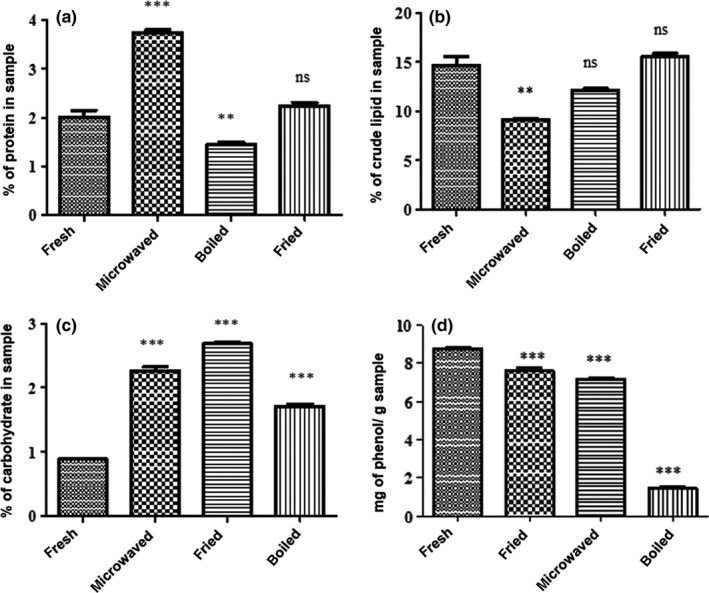
Effect of different cooking methods on: (a) crude protein content, (b) crude lipid content, (c) total carbohydrate content, and (d) total phenolic content of A. zambiana mushroom. ***p < .001 and **p < .01 compared to the fresh sample (one‐way ANOVA followed by Bonferroni's multiple comparison test). Results are expressed as ± standard deviation of three measurements