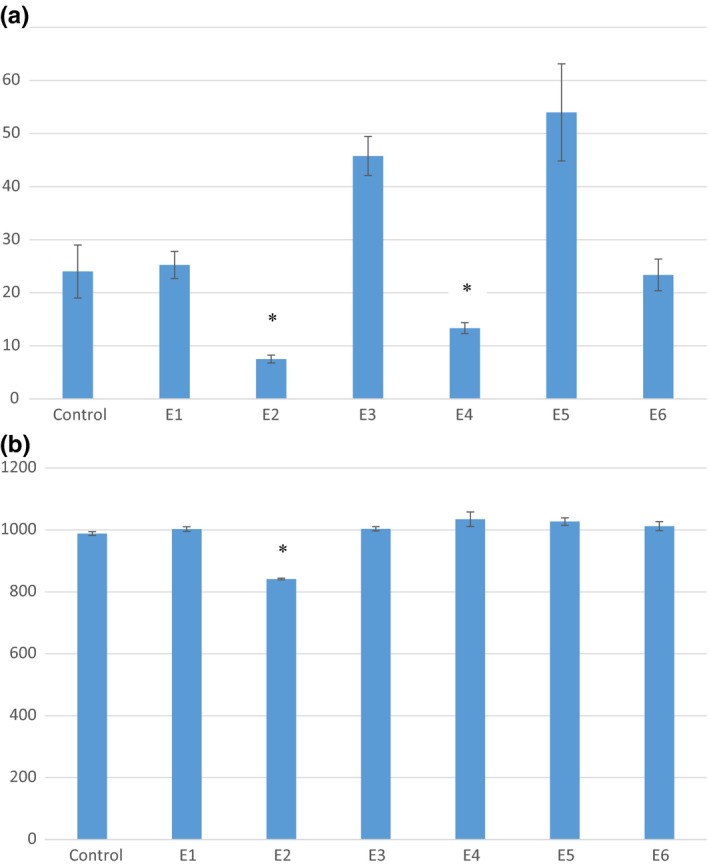
Figure 6.

Area under the growth curve comparison for Listeria monocytogenes grown in (a) 0.1% peptone and (b) TSB in association with jalapeño extract fractions E1–E6. Error bars represent standard error of the mean. An asterisk indicates mean AUC values that are significantly less that the AUC value of the L. monocytogenes control
