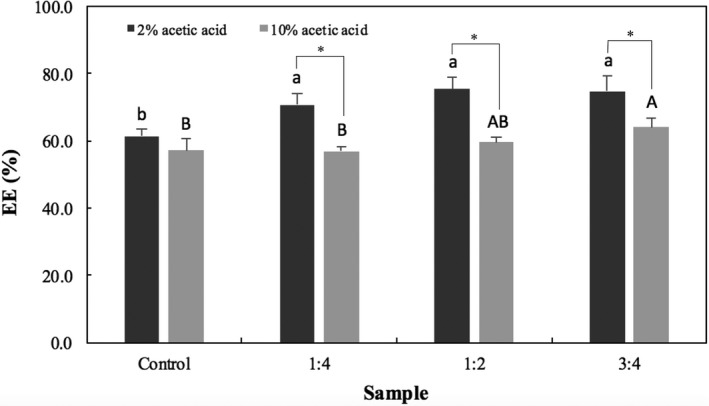
Figure 4.

EE of microspheres prepared with different CaCO 3:alginate ratios (1:4, 1:2, and 3:4) in comparison to the control (no carbonate added). Bars represent mean ± standard deviation (n = 3). Those identified with the same lower‐ and uppercase letters are not significantly different within groups (p < .05, Tukey's test) for gelation media containing 2 and 10% acetic acid glacial, respectively. Stars (*) indicate significant difference (p < .05) between groups
