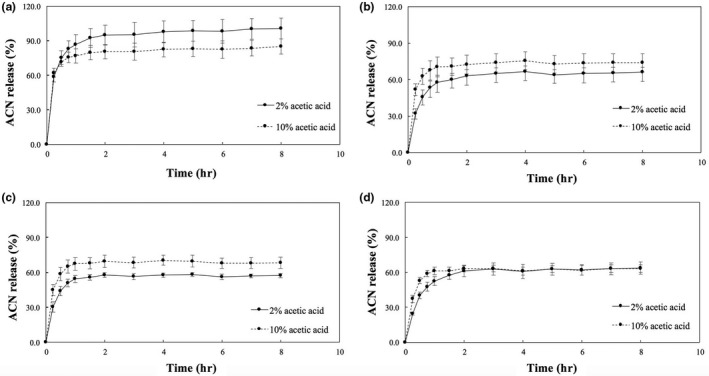
Figure 5.

In vitro ACN release profile for (a) control, (b) 1:4, (c) 1:2, and (d) 3:4 CaCO 3:alginate ratio microspheres prepared with 2 (continuous line) and 10% (dashed line) acetic acid in 0.1 N HCl with surfactant. Bars represent mean ± standard deviation (n = 3)
