
Figure 1.
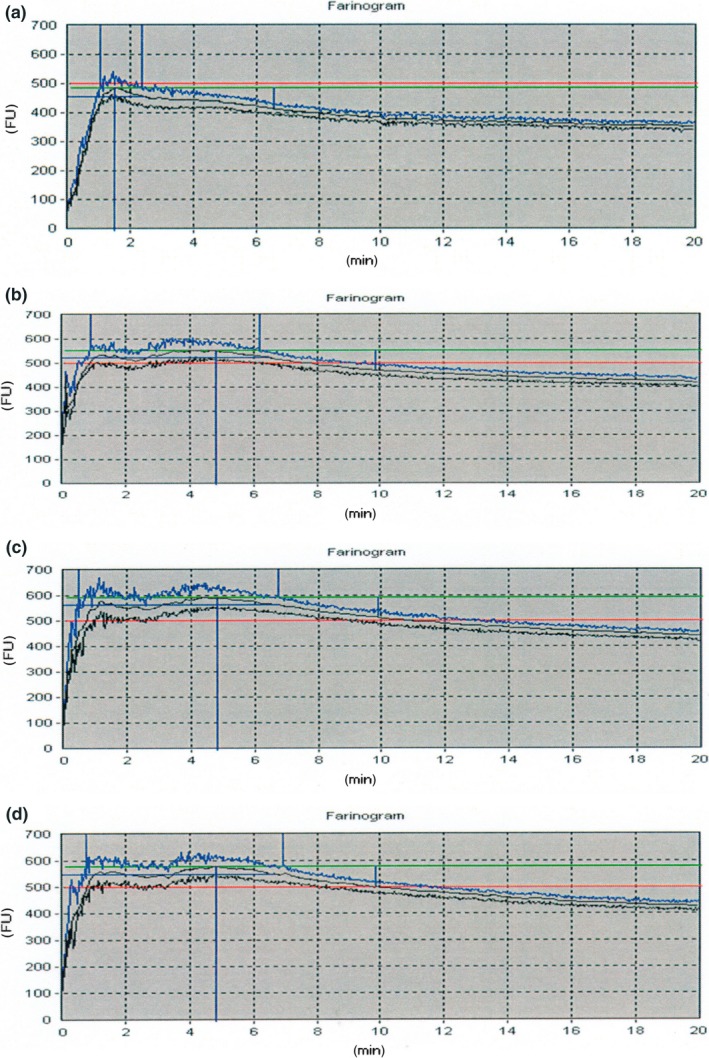
Typical farinograms of wheat (control) (a), blend with 10 g taro flour blend (b), 15 g taro flour (c), and 20 g taro flour (d)
Official websites use .gov
A
.gov website belongs to an official
government organization in the United States.
Secure .gov websites use HTTPS
A lock (
) or https:// means you've safely
connected to the .gov website. Share sensitive
information only on official, secure websites.
Typical farinograms of wheat (control) (a), blend with 10 g taro flour blend (b), 15 g taro flour (c), and 20 g taro flour (d)