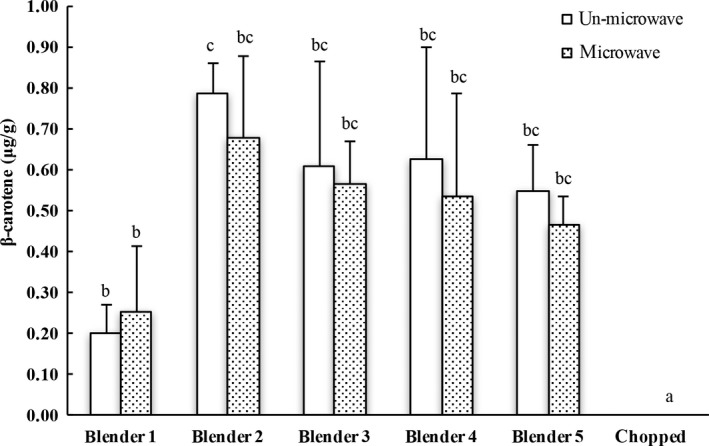
Figure 1.

HPLC analysis of β‐carotene in carrot extracts. The results are reported in μg β‐carotene per gram of fresh carrot. The vertical bars represent the standard deviation (n = 3) of each data point. Bar with different letter represents significant different at p < .05. HPLC, High performance liquid chromatography
