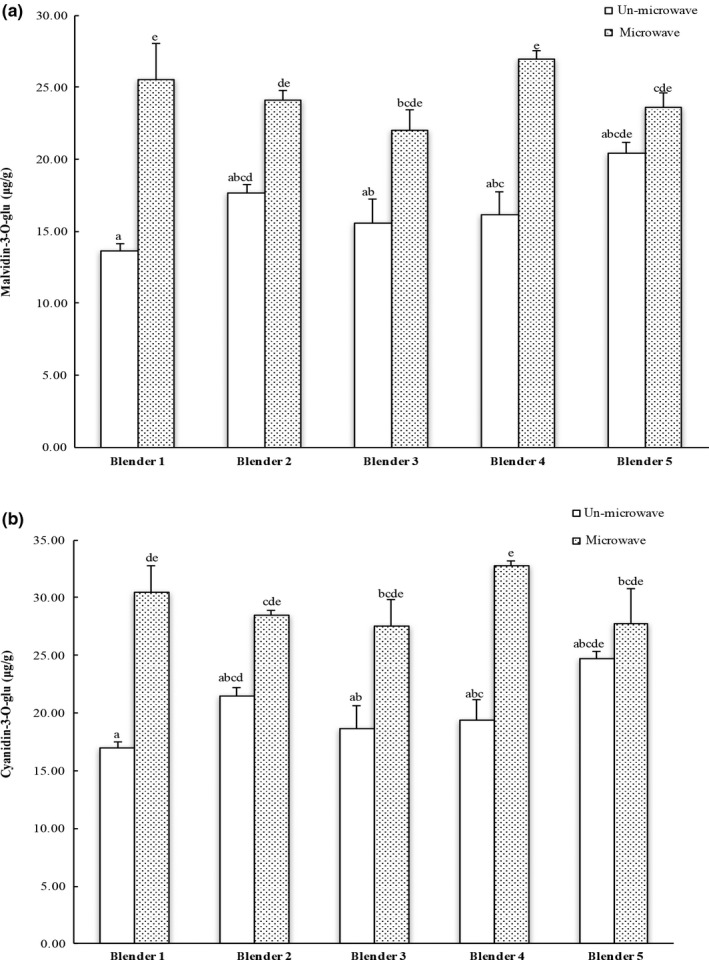
Figure 2.

HPLC analysis of (a) malvidin‐3‐O‐glucoside and (b) cyanidin‐3‐O‐glucoside in blueberry extracts. The results are reported in μg anthocyanins per gram of fresh carrot. The vertical bars represent the standard deviation (n = 3) of each data point. Bar with different letter represents significant different at p < .05
