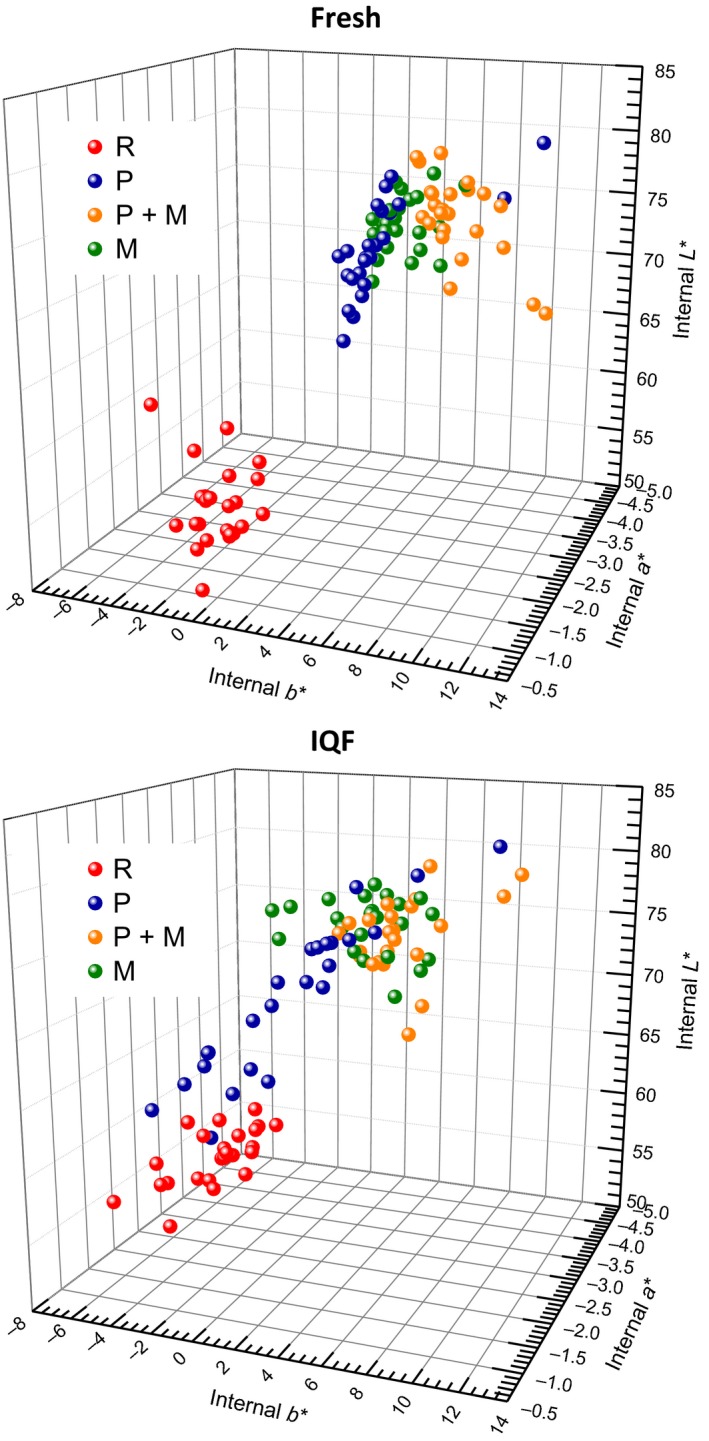
Figure 6.

Comparison of internal (vertical cross‐section surface) L*a*b* color values for both fresh and IQF catfish fillets between various treatments. Positive a* = degree of redness, positive b* = degree of yellowness, L* = lightness. Different treatments were noted with different colors of balls
