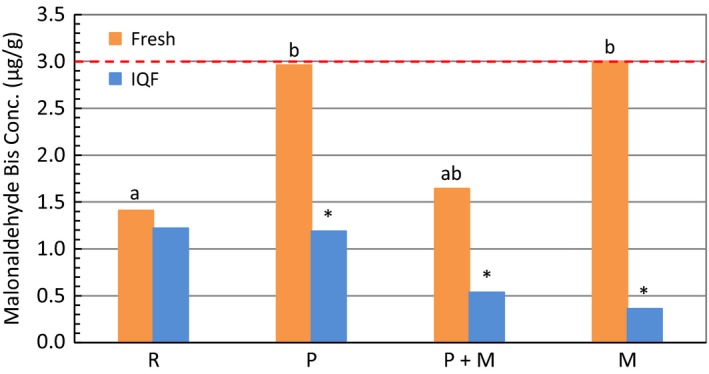
Figure 8.

Comparison of TBARS values for fresh and IQF fillets between various treatments. The threshold of MDA concentration that is considered good for consumption was marked with a red dotted line. Bars marked with the same letter designate no significant difference (p ˃ .05) between treatments. Significant differences between fresh and IQF for the corresponding treatment were noted with an asterisk above the bar of IQF samples
