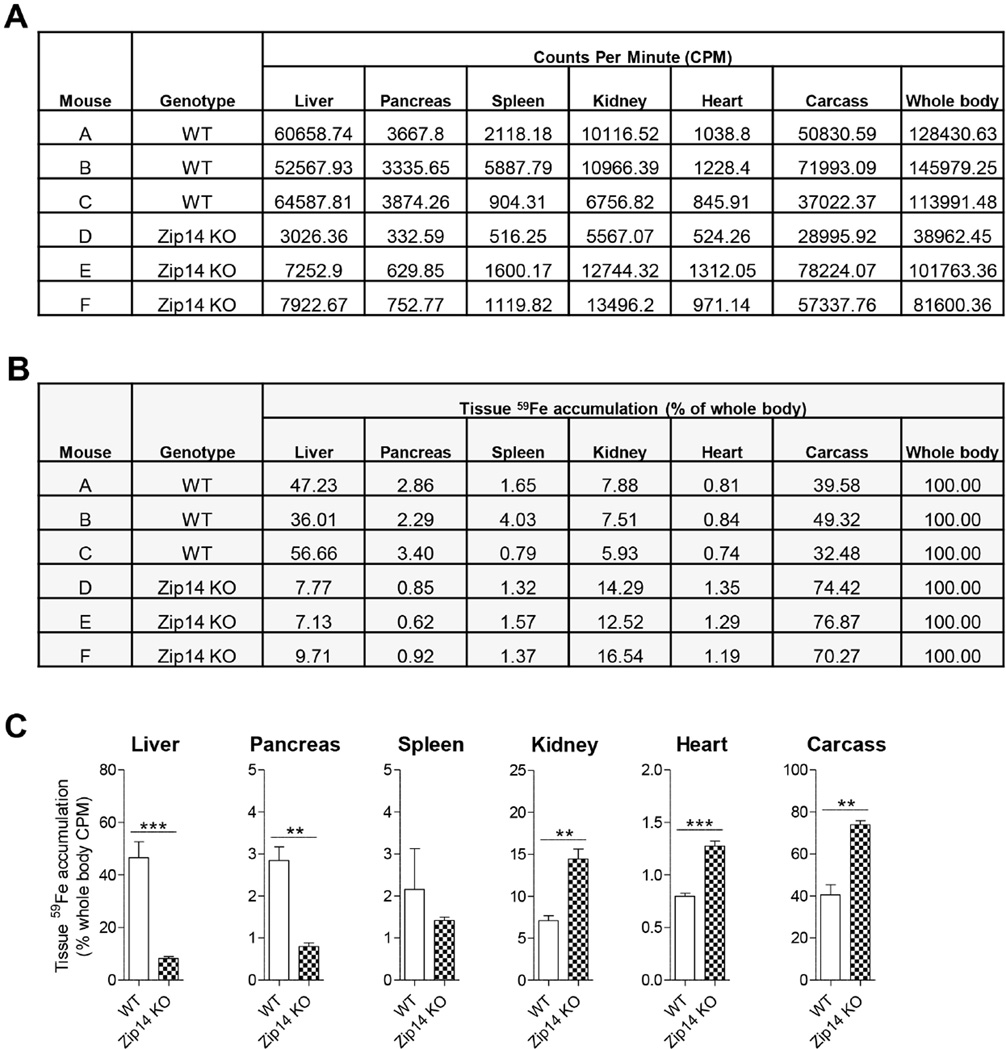
Figure 3. Example of raw data and analysis of results.
Two hours after injection with 59Fe-labeled ferric citrate, WT and Zip14 KO mice at 3 weeks of age were sacrificed and their tissues and carcasses were subjected to gamma counting. A. Counts per minute (CPM) values from each sample were recorded. Whole-body CPM values were calculated from the sum of all tissues and carcass CPMs. B. Tissue 59Fe accumulation is expressed as % of whole body and calculated as (tissue CPM/whole body CPM) × 100. C. Resultant figure from panel B is shown. Data were analyzed by using unpaired student’s t-test. Values are means ± SE (n = 3/group). ***P < 0.001, **P < 0.01.

