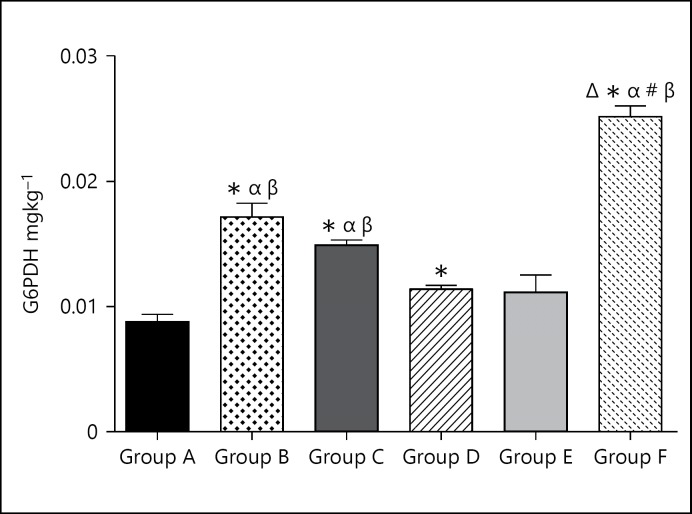
Fig. 5.
Bar chart showing the Glucose-6-Phosphate Dehydrogenate levels of control and treated groups after 21 days of treatment. * p < 0.05 when compared with group A; #p < 0.05 when compared with group B; Δp < 0.05 when compared with group C; βp < 0.05 when compared with group D; αp < 0.05 when compared with group E.

