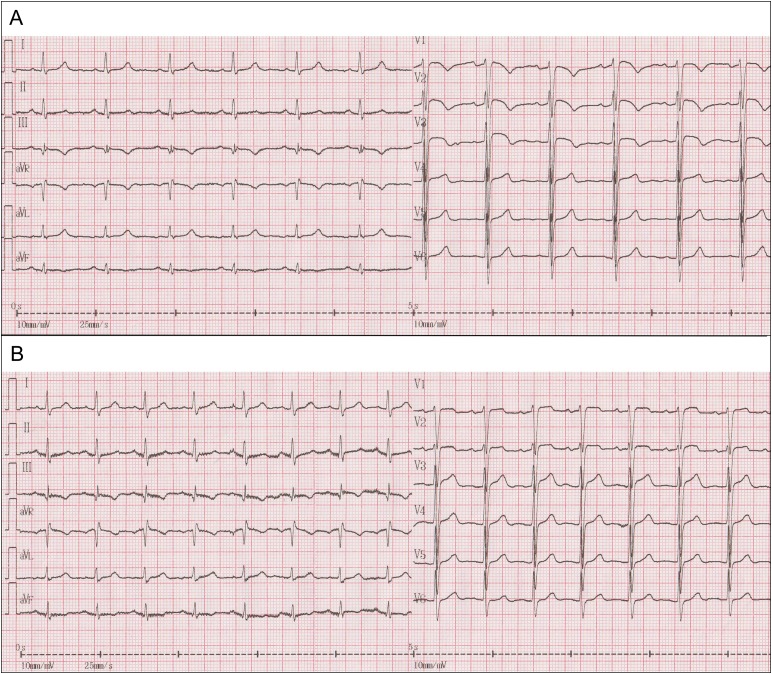
Figure 1:
(A) A 12-lead ECG of a patient with APE showing sinus rhythm, a S1Q3T3 pattern, ‘coved’ STE with T-wave inversion in the right precordial leads V1–V3. (B) ECG trace showing there was ongoing ST elevation in leads V1 and V2; however, the coved ST segment and T-wave inversion were resolved and looked less like typical Type 1 Brugada pattern following treatment of the embolism

