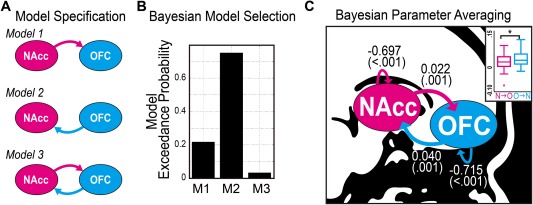
Figure 3.

Fronto‐accumbal effective connectivity estimated by spectral dynamic causal model (DCM). (A) Bayesian model specification for spectral DCM. (B) In the random effect Bayesian model selection scheme, Model 2 showed the highest model exceedance probability. (C) Bayesian Parameter Averaging using all three models showed significant bilateral excitatory connections between the OFC and the NAcc, and inhibitory recurrent connections. Connectivity estimates were shown (in Hertz) with P values to be different from zero (non‐parametric Wilcoxon signed rank test). As shown in the boxplot, the OFC to NAcc connectivity was greater than the NAcc to OFC connectivity (Wilcoxon signed rank test). NAcc, nucleus accumbens; OFC, orbitofrontal cortex. *P < 0.05. [Color figure can be viewed at http://wileyonlinelibrary.com.]
