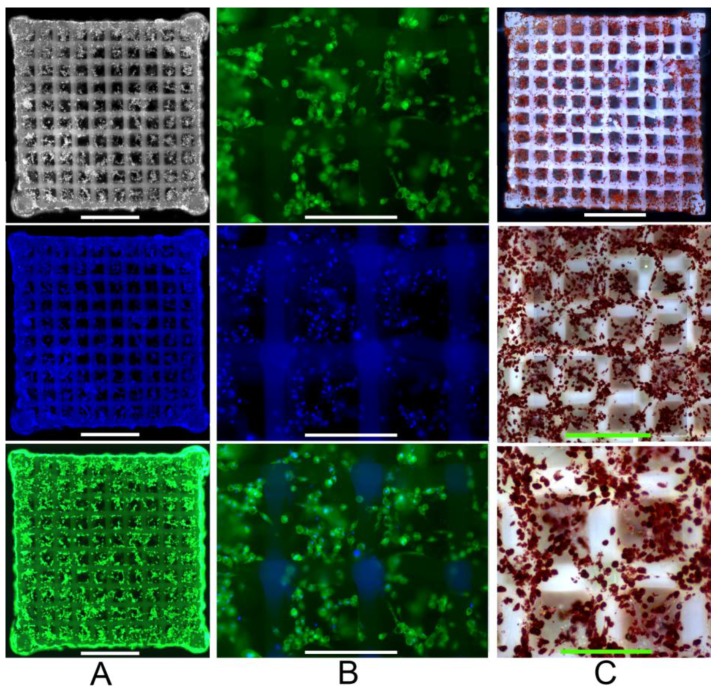
Figure 4.
Human ASCs within the 2PP Scaffold at day 22; (a) Staining with Calcein AM (cell viability stain, green fluorescence) and Hoechst 33,342 (cell nuclei stain, blue fluorescence) indicates the cell distribution (scale bars represent 1 mm); (b) Magnified scaffold view (scale bars represent 300 µm); (c) Oil Red O staining (i.e., indicator of intracellular lipid accumulation) (scale bars represent from top to bottom 1mm, 600 µm and 300 µm respectively).

