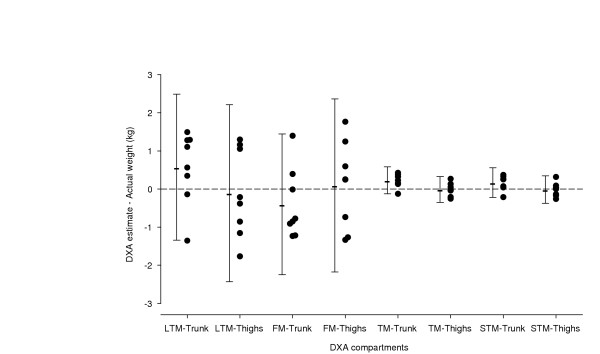
Figure 2.
The figure shows the differences between the actual weight and composition of added lard and the measured values by DXA, in eight lean healthy volunteers. In each subject DXA measurements were performed with lard placement both on the trunk and on the thighs. Each symbol indicates measurements in one subject. Error bars are the 95% confidence intervals of the difference.

