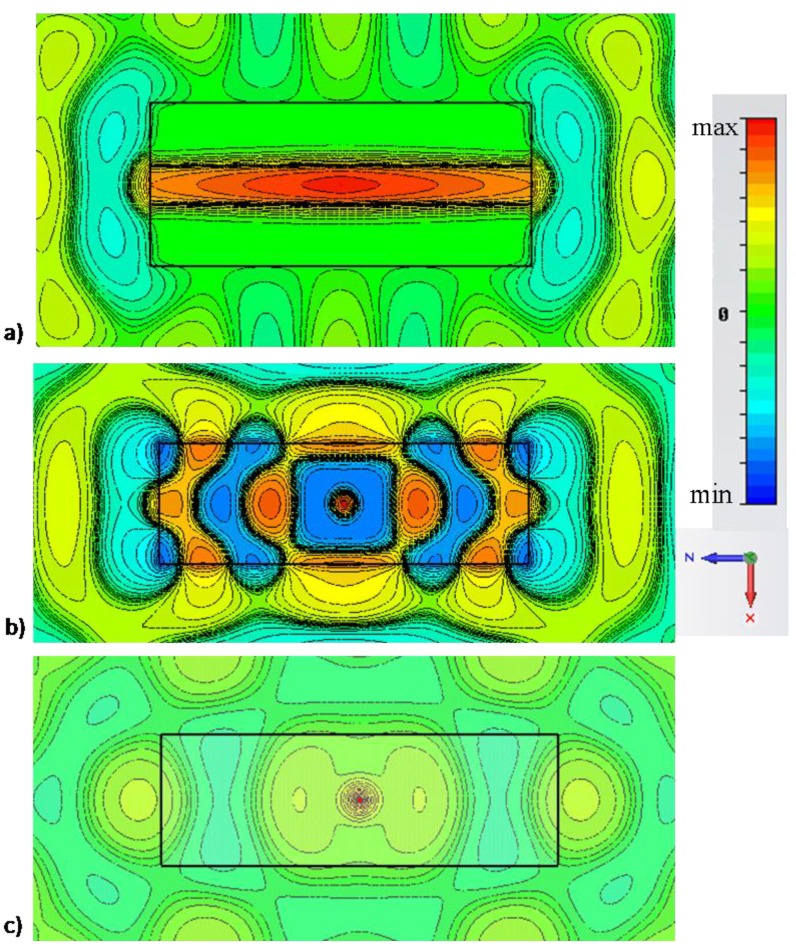
Figure 3.
Simulation results for field distribution (snapshot in time) of for a molecule emitting in the center of the narrow channel of Figure 1 at the cut-off wavelength for: (a) the scenario of Figure 1, (b) the same geometry, but with no side walls; (c) absence of the narrow channel. For this example: , , , . Similar results are shown in [9], but here different scales are used to highlight the phase variation along the channels for three different scenarios.

