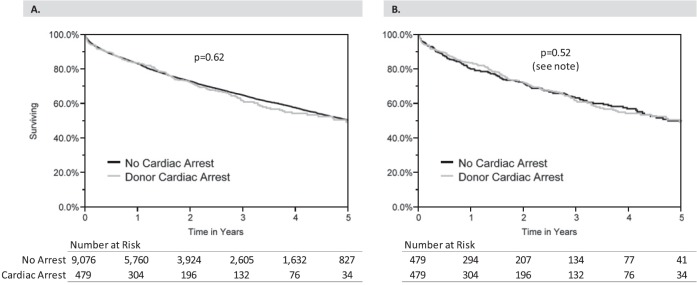
Figure 3.
Kaplan–Meier survival curves by donor cardiac arrest status. (A) Original total sample; (B) 1:1-matched cohort. Note: Statistical comparison for the original total sample was performed using the log-rank test, and for the 1:1-matched cohort was performed using the test described by Klein and Moeschberger to account for the matched nature of the data (34).

