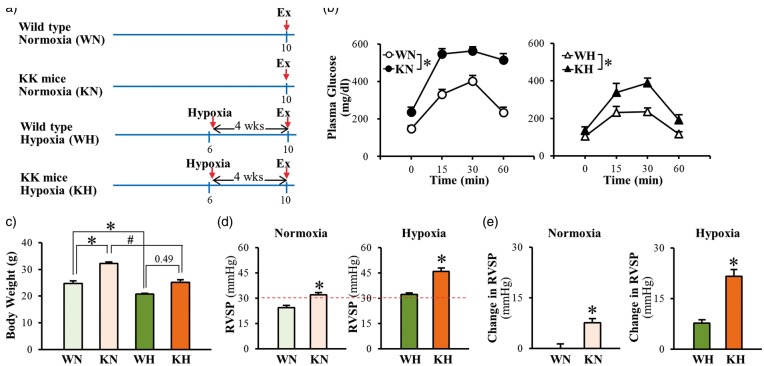
Fig. 2.
Chronic hypoxia-exposure increases RVSP in genetically modified type 2 mice (KK mice) greater than in wild-type mice. (a) Proposed experimental groups and protocols in mice. Wild-type normoxia (WN), KK mice normoxia (KN), wild-type hypoxia (WH), and KK mice hypoxia (KH). (b) Oral glucose tolerance test. Hypoxia decreased fasting glucose levels in both wild-type and KK mice; however impaired glucose tolerance still remains in KK mice. WN, n = 5; KN, n = 5; WH, n = 5; KH, n = 4. Data are mean ± SEM. *P < 0.05 vs. wild-type mice. (c) Body weight. Mice exposed to hypoxia exhibit lower body weight than mice under normoxia. WN, n = 5; KN, n = 5; WH, n = 5; KH, n = 4. Data are mean ± SEM. *P < 0.05 vs. WN, #P < 0.05 vs. KN. (d) RVSP. n = 6 per group. Data are mean ± SEM. *P < 0.05 vs. wild-type mice. (e) Change in RVSP. n = 6 per group. Data are mean ± SEM. *P < 0.05 vs. wild-type mice.

