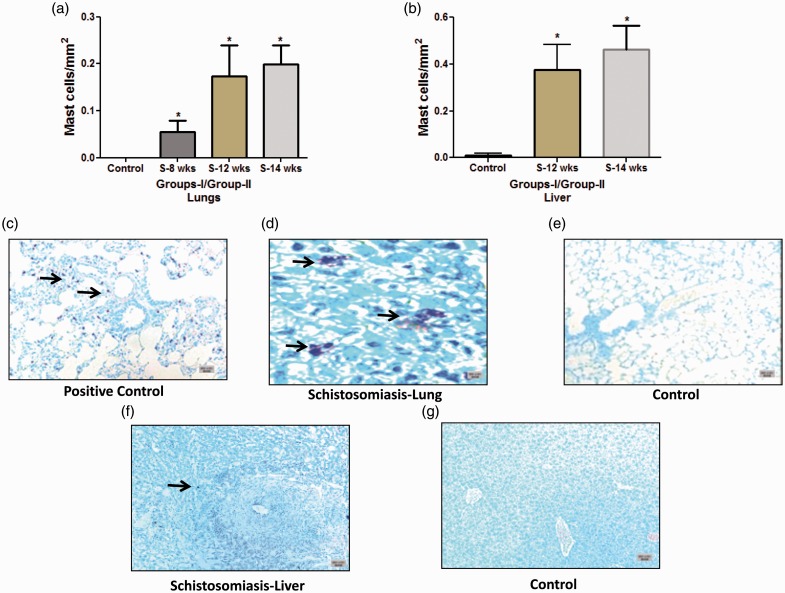
Fig. 1.
Quantification and staining of mast cells in Schistosoma-infected and non-infected healthy controls. (a) Quantification of mast cells from control, group I (8-week and 12-week infection) and group II (14-week infection) in the lungs; and (b) from control, group I (12-week infection) and group II (14-week infection) in the liver. (c–g) Paraffin tissue sections were stained with toluidine blue to detect mast cells. Shown are representative micrographs of (c) positive control (rat lung, with induced Monocrotaline, 5×); (d) Schistosoma-infected lung, 40×; (e) non-infected healthy control lung, 5×; (f) Schistosoma-infected liver sections, 5×; and (g) non-infected healthy control liver, 5×. Arrowheads indicate the positively stained cells (purple); scale bar = 20 µm.

