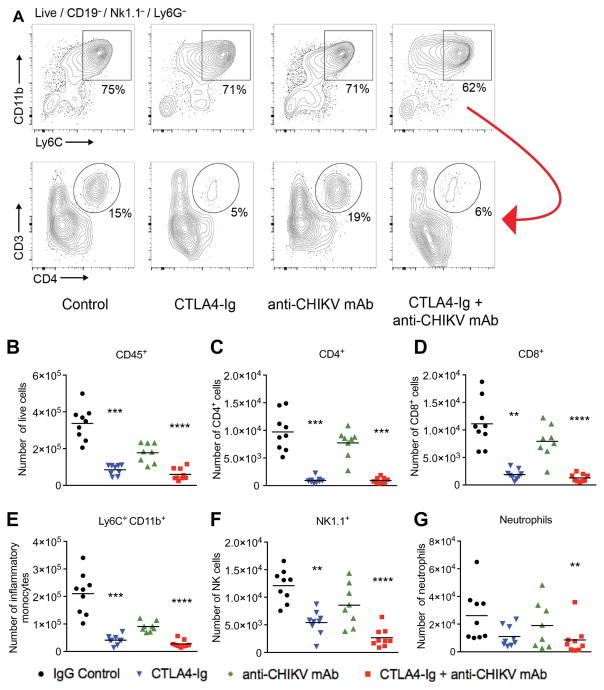
Fig. 6. Flow cytometry analysis of infiltrating leukocytes in the feet of mice on day 7 after infection with CHIKV.
Mice were inoculated with 103 FFU of CHIKV via a subcutaneous route. Mice received at day 3 a single intraperitoneal injection of 600 μg of isotype control antibody, 300 μg of CTLA4-Ig, 300 μg of anti-CHIKV mAb, or 300 μg of CTLA4-Ig and 300 μg of anti-CHIKV mAb. (A) Gating strategy showing subpopulations of live CD45+ cells, including the percentages of CD11b+Ly6C+ inflammatory monocytes, followed by CD3 and CD4 expression (lower panel) in the remaining Ly6C-negative cells (red arrow) isolated from the feet of mice from each treatment group. (B to G) Total number of isolated CD45+, CD4+, CD8+, Ly6C+CD11b+, NK1.1+, and Ly6G+ cells from the feet of CHIKV-infected mice in each treatment group. Results are pooled from two independent experiments with 4 to 5 mice per group in each experiment. Data represent the means ± SEM. **P < 0.005, ***P < 0.0005, ****P < 0.0001 (Kruskal-Wallis with Dunn’s post hoc analysis).

