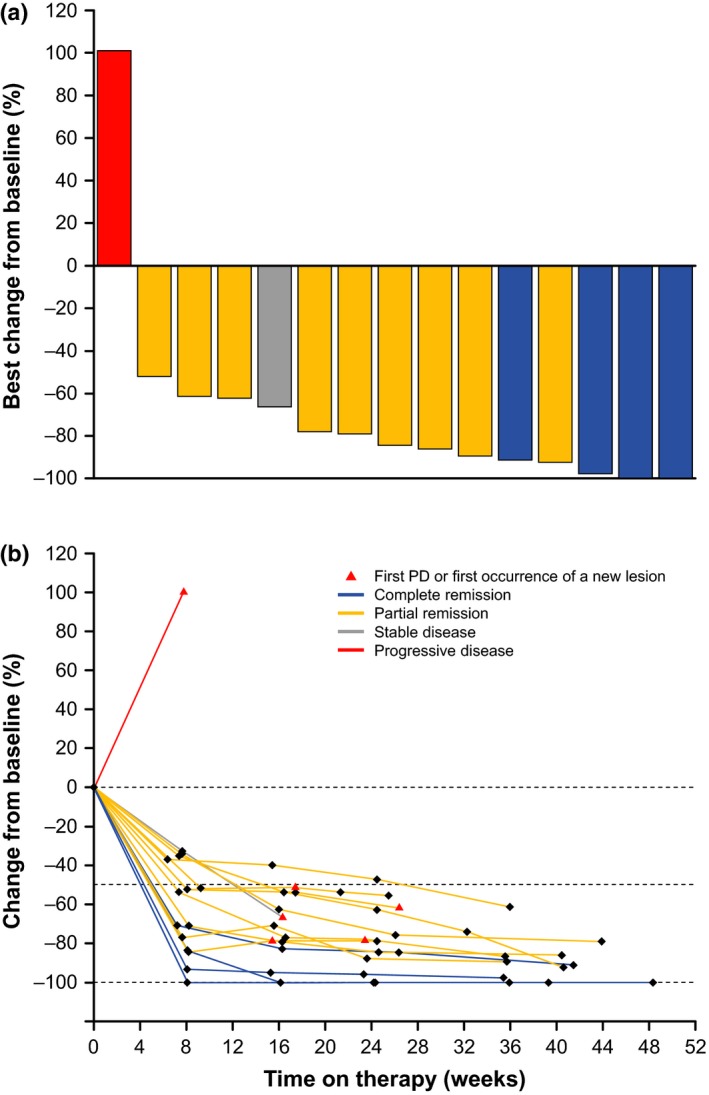
Figure 3.

Waterfall plot (a) and transition (b) of the maximum rate of change in the sum of the products of the diameters of the target lesion (evaluable patients, N = 15; efficacy data as assessed by a central review committee). Blue = complete remission; grey = stable disease; red = progressive disease; yellow = partial remission. PD, progressive disease.
