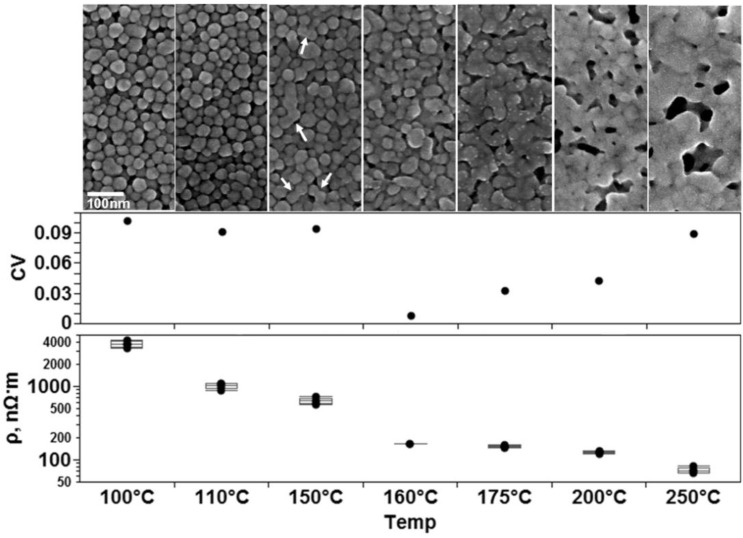
Figure 7.
SEM micrographs of the microstructures resulting from thermally curing printed traces of Cabot CCI-300 conductive ink for 1 h at the indicated temperatures. All images are at the same magnification. The corresponding graphical results of measured resistivity (ρ) are below the micrographs. The relationship between variation and method of conduction is not as clear as in the case of microparticle based ink. Sample size n = 5 for all sets.

