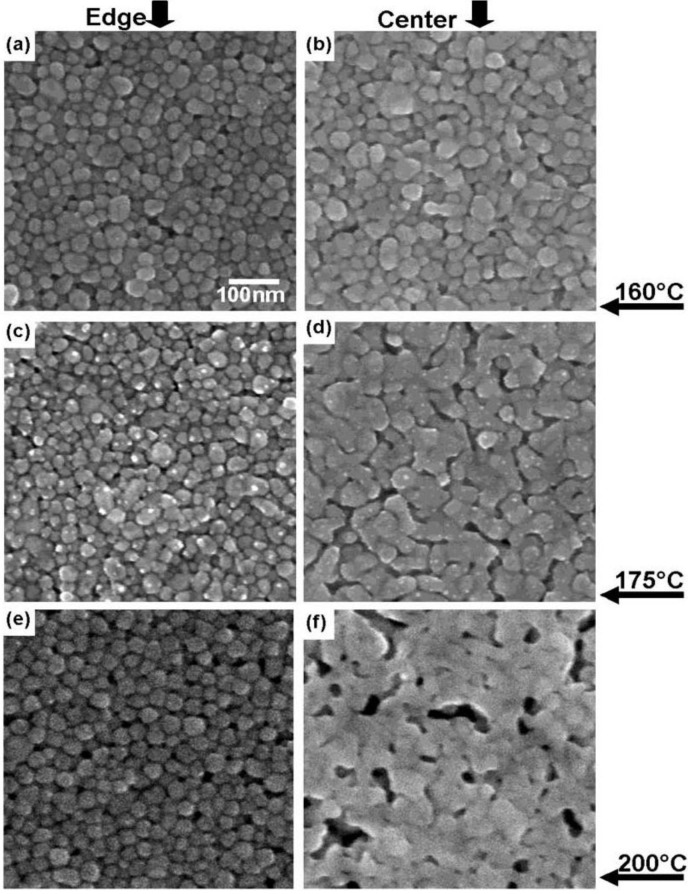
Figure 8.
SEM micrographs of CCI-300 printed lines comparing (a) the edge of a printed line with (b) the center of a printed line cured at 160 °C, (c) the edge and (d) the center of a line cured at 175 °C, (e) the edge and (f) the center of a line cured at 200 °C. All lines were printed in one layer and cured for 1 h. All images are the same magnification.

