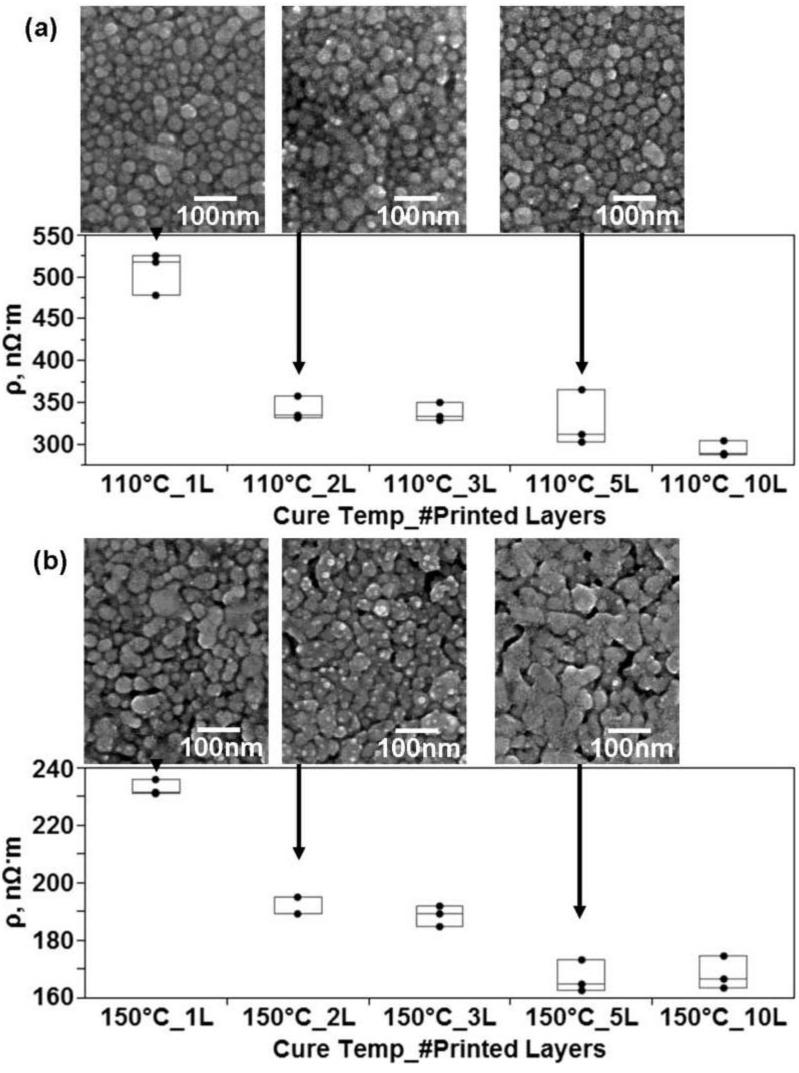
Figure 9.
Comparison of the microstructures and resistivity measurements of printed lines of CCI-300 resulting form a difference in the amount of layers printed prior to printing for (a) lines cured for 1 h at 110 °C and (b) lines cured for 1 h at 150 °C. Note the drop in resistivity when the amount of layers is increased to 2.

