
Figure 4.
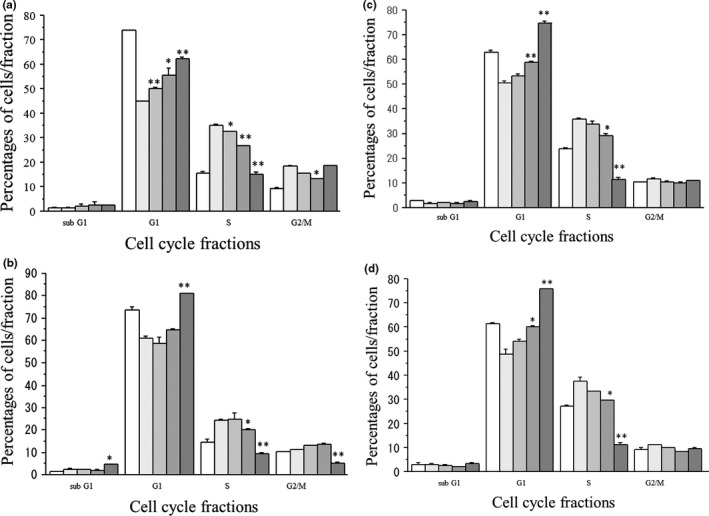
Effects of GANT61 (0–20 μM) on cell cycle progression in MCF‐7 cells (a), T‐47D cells (b), KPL‐1 cells (c) and KPL‐3C cells (d). Cells were treated with 1 nM estradiol (E2) and the indicated concentrations of GANT61 for 2 days. Percentages of cells at each cell cycle phase were analyzed as described in the Materials and Methods. The values are means ± SE. White bars, control; the most light grey bars, E2 plus 1 μM GANT61; the second light gray bars, E2 plus 5 μM GANT61; the third light gray bars, E2 plus 10 μM GANT61; and the most dark grey bars, E2 plus 20 μM GANT61. *P < 0.05; **P < 0.01 in comparison with cells treated with E2 alone.