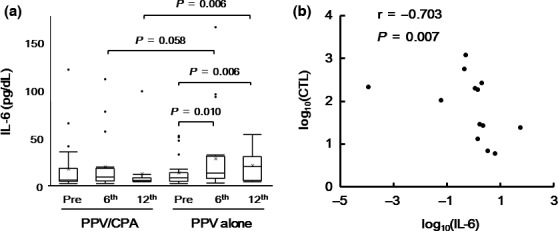
Figure 5.

Plasma IL‐6 values before and after personalized peptide vaccination (PPV). (a) The values of IL6 in plasma were examined before and after PPV (6th and 12th vaccination). Box plots show median and interquartile range (IQR). The whiskers (vertical bars) are the lowest value within 1.5× IQR of the lower quartile and the highest value within 1.5× IQR of the upper quartile. Data not included between the whiskers were plotted as an outlier with dots. “X” shows the mean of the data. (b) The correlation between the changes of plasma IL‐6 and those of T cell responses against the vaccinated peptides after vaccination were evaluated by Spearman's Rank correlation test.
