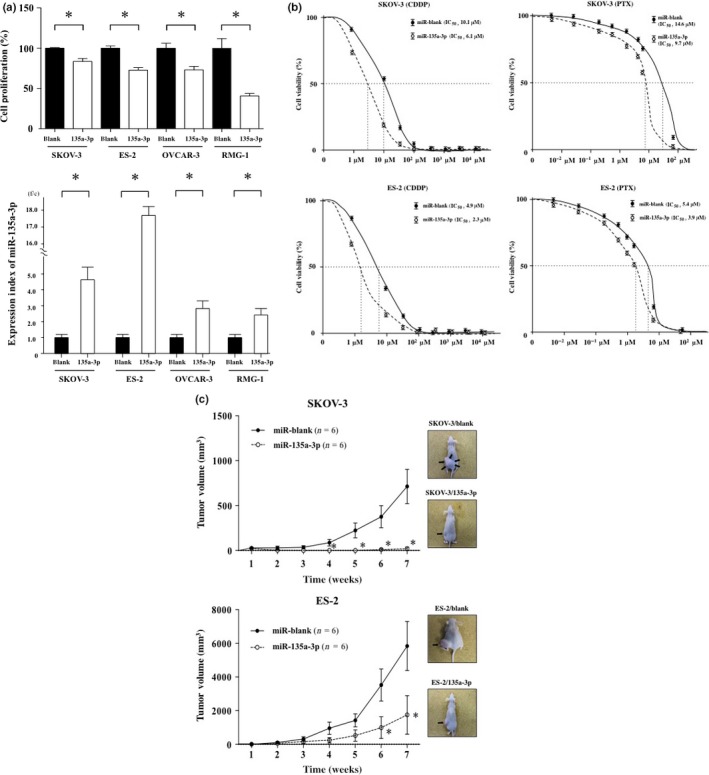
Figure 3.

Assessment of antitumor properties induced by the introduction of miR‐135a‐3p gene into ovarian cancer cells. Alterations in cell proliferation and the expression index of microRNA (miR)‐135a‐3p induced by the transfection of miR‐135a‐3p expression vector or miR‐blank expression vector into SKOV‐3, ES‐2, OVCAR‐3, or RMG‐1 cells. (a) Closed and open columns indicate the cell proliferation of miR‐blank or miR‐135a‐3p in the upper figure, and the expression index of miR‐blank or miR‐135a‐3p of each cell line in lower figure, respectively. *P < 0.05. All data indicate mean ± standard error. (b) Closed (solid line) and open (dotted line) circles indicate the cell viability of SKOV‐3 and ES‐2 cells transfected with miR‐blank or miR‐135a‐3p expression vectors. Alteration in cell viability of SKOV‐3 or ES‐2 cells transfected with miR‐blank or miR‐135a‐3p expression vector in the presence of various concentrations of cisplatin (CDDP) or paclitaxel (PTX). In addition, the IC 50 values of CDDP and PTX were calculated. (c) Closed (solid line) and open (dotted line) circles indicate the tumor volume of SKOV‐3 and ES‐2 cells transfected with miR‐blank or miR‐135a‐3p. Each tumor was inoculated 7 weeks after the s.c. injection of the transfected cells. Arrows indicate tumor. *P < 0.05. n, number of mice. All data indicate mean ± standard error.
