
Figure 4.
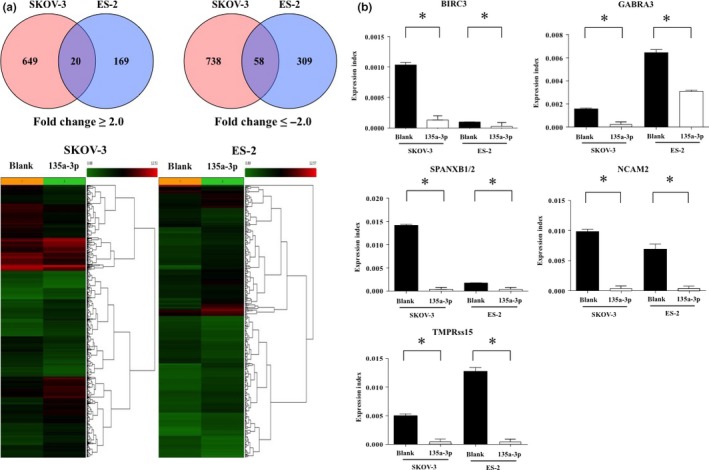
Expression changes in genes targeted by the transfection of miR‐135a‐3p gene in ovarian cancer. Gene profiling between SKOV‐3 and ES‐2 cells transfected with microRNA (miR)‐135a‐3p or miR‐blank. (a) Alterations in the expression of commonly targeted genes between SKOV‐3 and ES‐2 cells transfected by miR‐135a‐3p. Red and blue circles indicate SKOV‐3 and ES‐2 in Venn diagram, respectively. Numbers indicate the number of targeted genes. The number of intersections in the Venn diagram is the number of targeted genes of fold change ≥2.0 or fold change <2.0. In the heatmap in the lower figure, the red signal indicates high expression of targeted genes, and green signal indicates low expression of genes. (b) Closed and open columns indicate the expression of targeted genes in SKOV‐3 and ES‐2 cells transfected by miR‐blank or miR‐135a‐3p. All data indicate mean ± standard error. Bar indicates standard error. *P < 0.05.