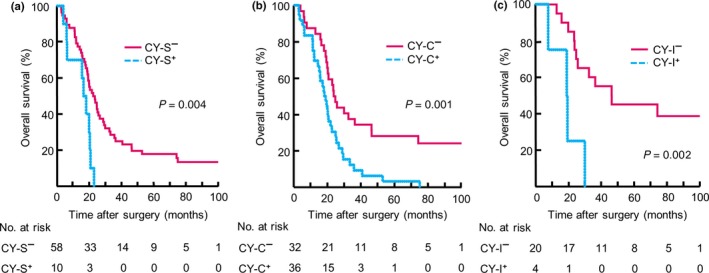
Figure 3.

(a) Kaplan–Meier curves for signet ring cell present (CY‐S+) and absent (CY‐S−) subgroups in 68 patients with positive peritoneal lavage cytology findings (CY+) (b) Kaplan–Meier curves for ≥5 cell clusters (CY‐C+) and cell clusters <5 (CY‐C−) subgroups among 68 CY+ patients (c) Kaplan–Meier curves for ≥50 isolated cancer cells (CY‐I+) and isolated cancer cells <50 (CY‐I−) subgroups in 24 CY+ patients without either CY‐S+ or CY‐C+. Numbers of patients at risk are shown below each curve.
