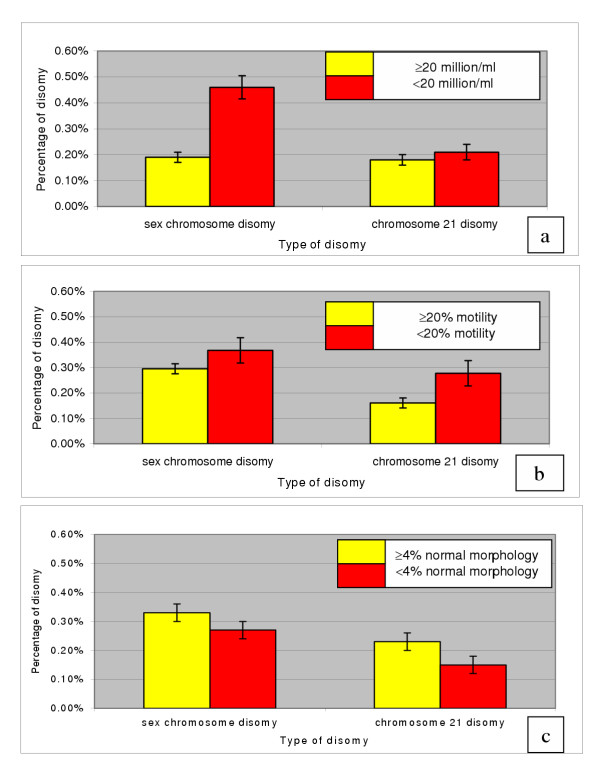
Figure 1.
a) Mean sperm disomy frequencies for the sex chromosomes and chromosome 21 in two groups with sperm concentration of ≥ 20 million/ml and < 20 million/ml. b) Mean sperm disomy frequencies for the sex chromosomes and chromosome 21 in two groups with percentage of motility of ≥ 20% motility and < 20% sperm motility. c) Mean sperm disomy frequencies for the sex chromosomes and chromosome 21 in two groups with ≥ 4% normal morphology and < 4% normal morphology. Error bars represent SEM.

