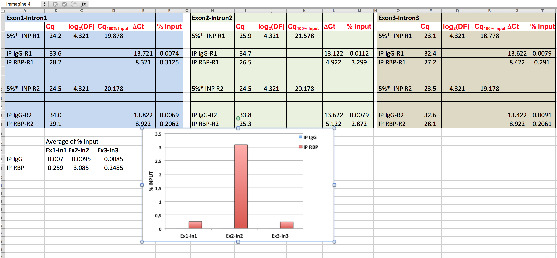
Figure 6. Data analysis of RBP association to RNA target.

Using hypothetical Cq values, data analysis of RBP binding to the indicated pre-mRNA regions (Exon1-Intron1; Exon2-Intron2; Exon3-Intron3) is shown. * = % of Input is 5% see steps C2 and D2f; DF (dilution factor) = 20; R = replicate.
