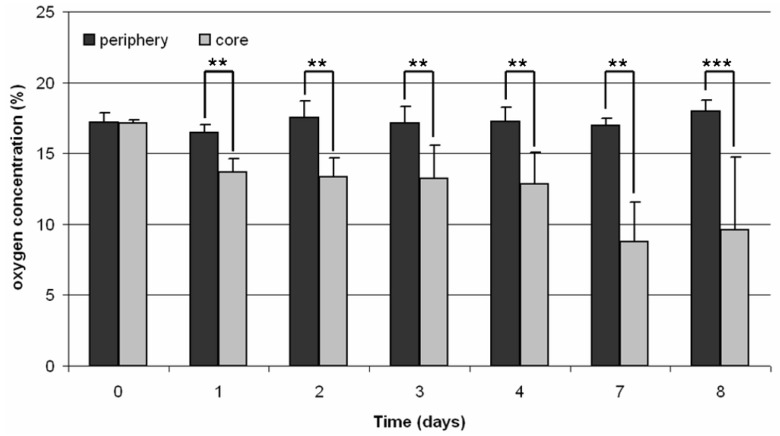
Figure 4.
Oxygen concentration in a static 3D cell culture of human osteoblasts (n = 4). Measurement was done in the periphery as well as in the core of the TCP scaffold. Data are demonstrated as mean values ± standard deviation. Statistical analysis was done with ONEWAY ANOVA (Post hoc LSD). Significance is based on the respective oxygen concentration of the periphery (** p < 0.01; *** p < 0.001).

