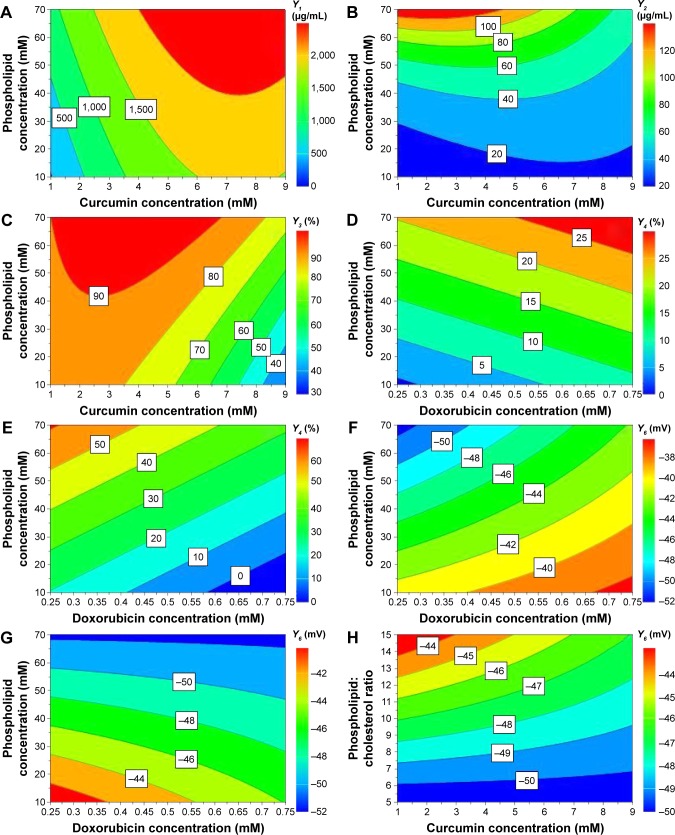
Figure 3.
Contour plots showing the interaction between variables on the responses: the effect of X1X2 on entrapped CUR concentration, at 55°C and pH 5 (A); the effect of X1X2 on entrapped DOX concentration, at 55°C and pH 5 (B); the effect of X1X2 on CUR entrapment efficiency, at 55°C and pH 5 (C); the effect of X1X3 on DOX entrapment efficiency, at 55°C and pH 4.5 (D) and 5 (E); the effect of X1X3 on zeta potential, at 55°C and pH 4.5 (F) and 5 (G); and the effect of X2X6 on zeta potential, at 55°C and pH 5 (H).
Notes: X1, phospholipid concentration (mM); X2, curcumin concentration (mM); X3, doxorubicin concentration (mM); X6, phospholipid:cholesterol molar ratio.
Abbreviations: CUR, curcumin; DOX, doxorubicin.

