
Fig. 1. cTnI and cTnT protein levels in mice at different ages.
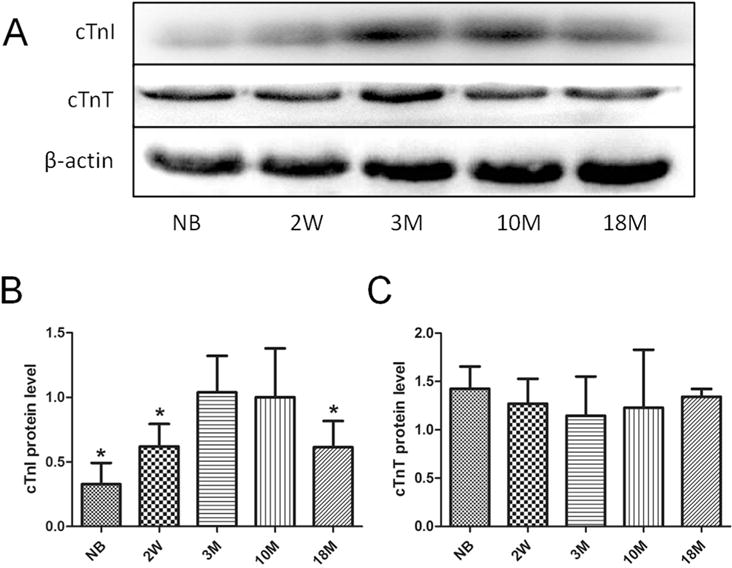
(A)Western blotting analysis using cTnI and cTnT antibodies. β-actin was used as protein loading control. Summary of Western blotting results of cTnI and cTnT are shown in Fig. 1B and C. Values are expressed as means ± SD from 4 separate experiments. The data from 3-month-old mice was set as 1 to compare with the data from other animal groups. Statistical significance was determined by ANOVA followed by Least—Significant Difference (LSD) tests. *p < 0.05 as compared with 3 m group.