
Fig. 2. cTnI mRNA levels in mice at different ages.
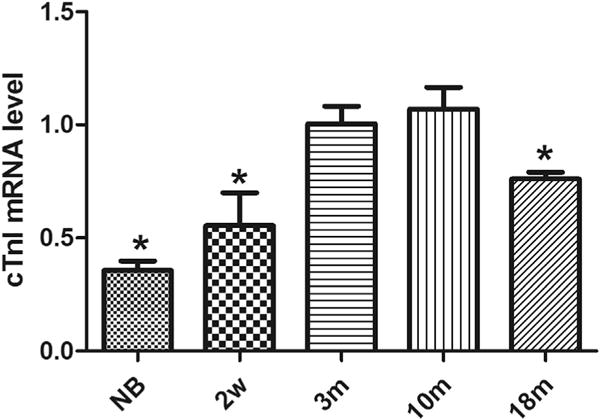
The expression pattern of cTnI mRNA was determined in the hearts of mice at various ages. The results are expressed as mean ± SD from at least three separate experiments. The data from 3-month-old mice was set as 1 to compare with the data from other animal groups. Statistical significance was determined by ANOVA followed by Least—Significant Difference (LSD) tests. *p < 0.05 as compared with 3 m group.