
Fig. 3. Cardiac ultra-structures evaluation.
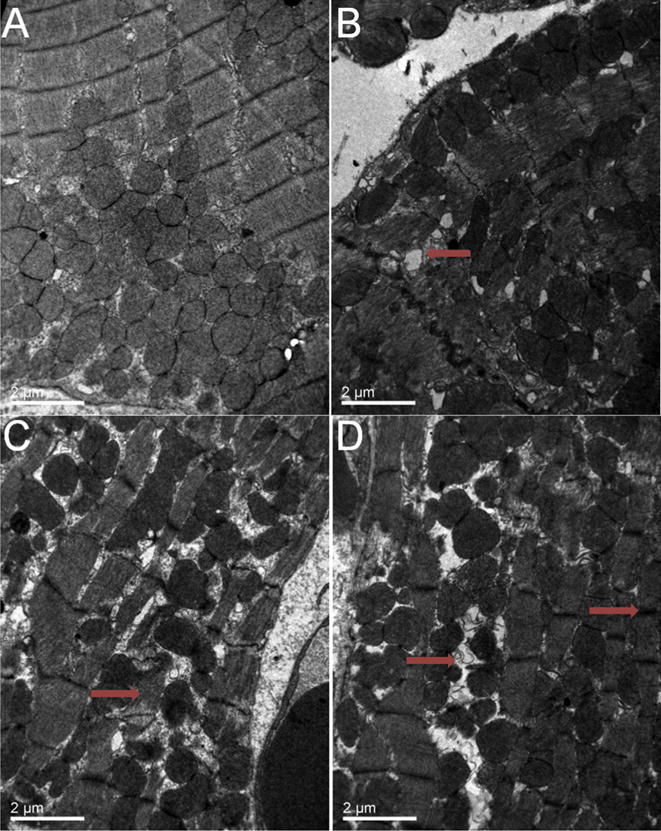
Fig. 3A shows the ultra-structures of heart tissue in left ventricle of 3-month mouse (10000 ×). Ultra-structures of heart tissue in left ventricle of 18-month mouse (10000 ×) are showed in Fig. 3B–D. Red arrow in Fig. 3B shows an enlargement of sarcoplasmic reticulum; red arrow in Fig. 3C displays sarcomere dissolution; and red arrows in Fig. 3D indicate hydropic degeneration (left) and thickening of Z line (right). Scale bars in A–D = 2 μm. (For interpretation of the references to colour in this figure legend, the reader is referred to the web version of this article.)